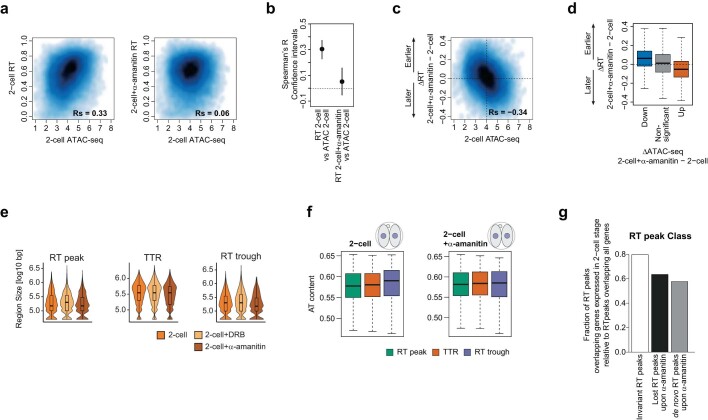
Extended Data Fig. 9. Relationship between ATAC-seq and RT changes upon transcriptional inhibition.
a. Smoothed scatterplot showing correlation between ATAC-seq signal and RT values in 2-cell stage embryos (left) and in α-amanitin treated 2-cell stage embryos (right). Rs indicates Spearman’s R. b. Pairwise Spearman´s correlation coefficients (R) between RT and ATAC-seq signal in untreated and in α-amanitin treated 2-cell stage embryos. Error bars indicate the 95% bootstrap confidence interval. Dot represents the mean of 1000 bootstrapped values. c. Smoothed scatterplot depicting the difference of RT values (ΔRT) between α-amanitin treated and untreated 2-cell embryos against ATAC-seq signal in control 2-cell stage embryos. d. Difference of RT values (ΔRT) at genomic bins that significantly lose accessibility (down), gain accessibility (up) or remain unchanged (non-significant) upon α-amanitin treatment in 2-cell stage embryos. Box plots show median and the interquartile range (IQR), whiskers depict the smallest and largest values within 1.5 ×IQR. e. Size of RT peaks, TTRs and RT troughs in control versus α-amanitin or DRB treated 2-cell embryos. f. A + T content in RT peaks, TTRs, and RT troughs in 2-cell and α-amanitin treated 2-cell embryos. Box plots show median and the interquartile range (IQR), whiskers depict the smallest and largest values within 1.5 ×IQR. g. Fraction of RT peaks containing genes expressed at the 2-cell stage relative to all genes in RT peaks specific to 2-cell stage embryos upon α-amanitin treatment (de novo), in RT peaks specific to control 2-cell stage embryos (lost) and RT peaks present in both 2-cell control and α -amanitin treated embryos.

