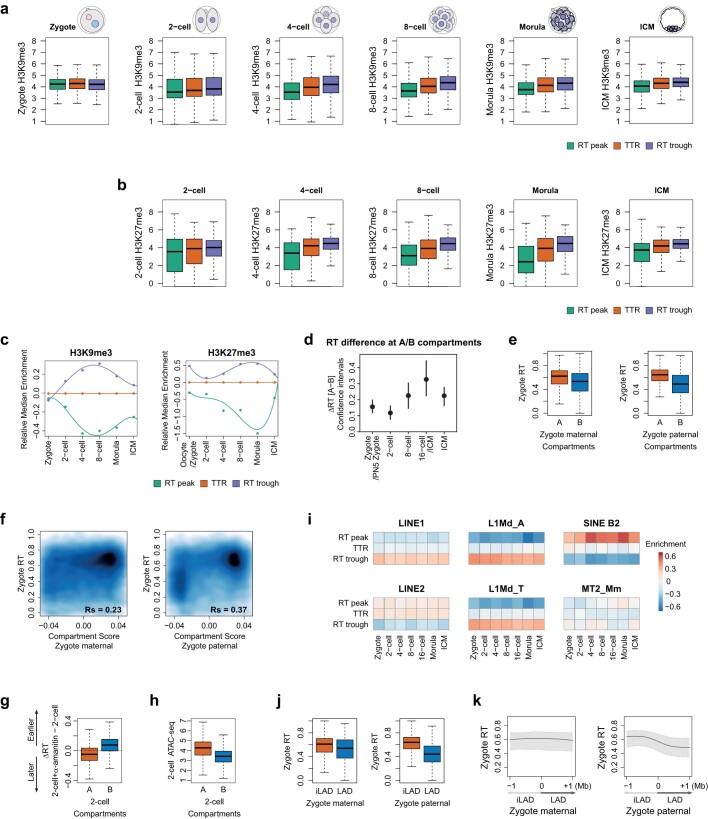
Extended Data Fig. 10. Characterisation of silent chromatin features of the embryonic replication programme and of the parental RT differences of LADs and compartments.
a., b. Box plots depicting H3K9me3 (a) or H3K27me3 (b) coverage at the indicated replication features at different embryonic stages. c. Kinetics of the relative changes in the enrichment of histone modifications at RT peaks and RT troughs normalised to TTRs from the zygote to the blastocyst stage ICM. The ‘oocyte/zygote’ time point indicates H3K27me3 data from oocytes, before fertilisation, and RT from zygotes (after fertilisation). d. Analysis to determine statistical significance on the RT differences between A and B compartments based on confidence intervals. Confidence intervals for the difference of replication timing (ΔRT) between A and B compartments. Error bars indicate the 95% bootstrap confidence interval. Dot represents the mean of 1000 bootstrapped values. e. Box plots of zygote RT values in maternal (left) and paternal (right) A and B compartments. f. Smoothed scatterplots showing the correlation between zygote RT values and maternal and paternal compartment scores. g. Box plot depicting the difference of RT values (ΔRT) between α-amanitin treated and untreated 2-cell embryos in A- and B-compartments. h. Box plot depicting the ATAC-seq signal in A- and B-compartments in untreated 2-cell stage embryos. i. Enrichment of the main families of transposable elements across replication features during early development. Color key indicates the number of overlapping TEs relative to randomly shuffled. j. Box plots showing RT values of zygotes within the corresponding zygotic maternal (left) and paternal (right) iLADs and LADs. k. Composite plot showing RT values of zygotes plotted against maternal and paternal zygotic LADs. The zero indicates the position of the LAD/iLAD boundaries. Shading shows IQR and the line indicates the median. In a, b, e, g, h, j the box plots show median and the interquartile range (IQR), whiskers depict the smallest and largest values within 1.5 ×IQR.

