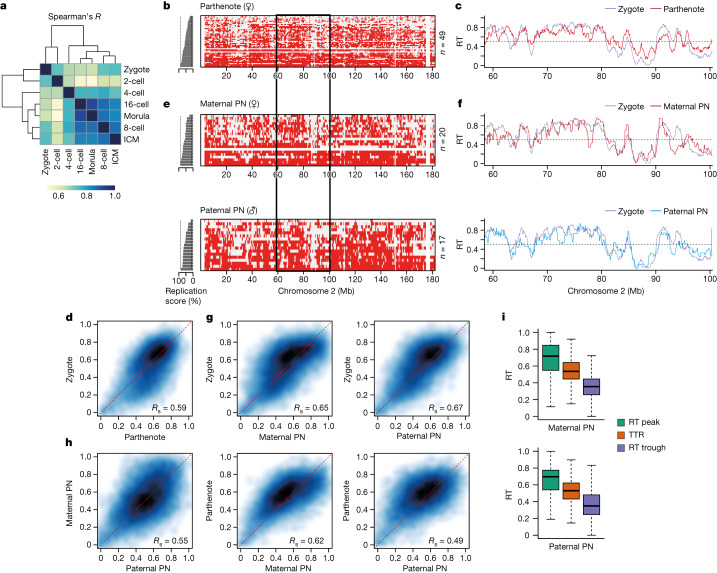
Fig. 2. RT in zygotes is less well defined compared with that in later embryonic stages and does not exhibit global allelic differences.
a, Correlation of genome-wide RT values between the indicated stages of preimplantation embryos using Spearman’s R. b,c, Characterization of RT in parthenogenetic zygotes. Heatmaps show replication states in parthenogenetic embryos (b) and corresponding average RT profiles (c). d, Smoothed scatterplot of RT values in normal versus parthenogenetic zygotes. Spearman’s correlation (Rs) is indicated. e,f, Characterization of RT in physically isolated maternal and paternal pronuclei (PN). Heatmaps show replication states in each pronucleus (e) and corresponding average RT profiles (f) of the chromosome 2 region, indicated by the black rectangle. g, Smoothed scatterplot of RT values in zygotes compared with isolated maternal and paternal pronuclei. Spearman’s correlation is indicated. h, Smoothed scatterplot of RT values comparing maternal or paternal pronucleus and parthenogenetic zygotes, as indicated. Spearman’s correlation is indicated. i, RT values of RT peaks, TTRs and RT troughs in isolated maternal and paternal pronuclei. Box plots show median and IQR, whiskers depict the lowest and highest values within 1.5× IQR.

