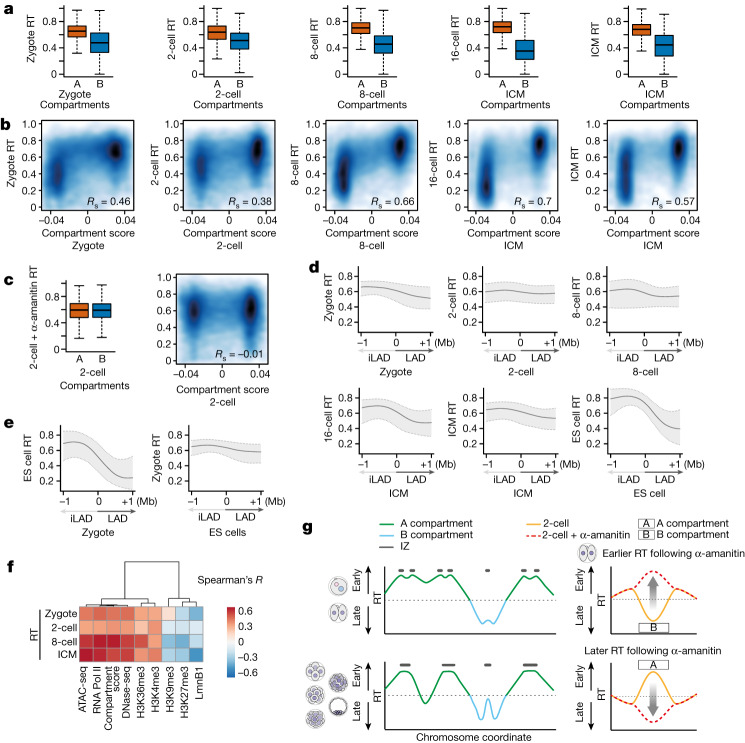
Fig. 5. The distinctive RT between A and B compartments is dependent on ZGA, and three-dimensional genome organization precedes partitioning of early- and late-replication dynamics.
a, Box plots showing RT values in A and B compartments at the indicated stages. Note that, because HiC (high-throughput chromosome conformation capture) data for the 16-cell stage were unavailable, we used the closest developmental stage (ICM) for this comparison. b, Smoothed scatterplots showing correlation between RT values and compartment score at the indicated stages. Spearman’s correlation is indicated. c, Box plots showing RT values in A and B compartments (left) and correlation between RT values and compartment score (right) in α-amanitin-treated, 2-cell-stage embryos. d, Composite plots depicting RT values computed against LADs and iLADs at their corresponding developmental stage. Zero indicates the position of LAD–iLAD boundaries. Because DamID data for the 16-cell stage were not available, we used the closest developmental stage (ICM) for this comparison. e, Composite plots depicting RT values of mouse ES cells plotted against zygotic LADs (left) and RT values of zygotes against LADs in ES cells (right). Zero indicates the position of LAD–iLAD boundaries. d,e, Shading and lines indicate IQR and median, respectively. f, Correlation (Spearman’s R) heatmap between RT and distinctive chromatin features. When data for the same stage as RT are not available, those of the closest stage are used for analysis. g, Model summarizing our findings indicating progressive resolution of RT following the 2-cell stage. Left, RT peaks merge over time, resulting in changes in both number and size. Right, the effect of ZGA inhibition on RT and its relationship to A and B compartments. a,c, Box plots show median and IQR, whiskers depict the lowest and highest values within 1.5× IQR.

