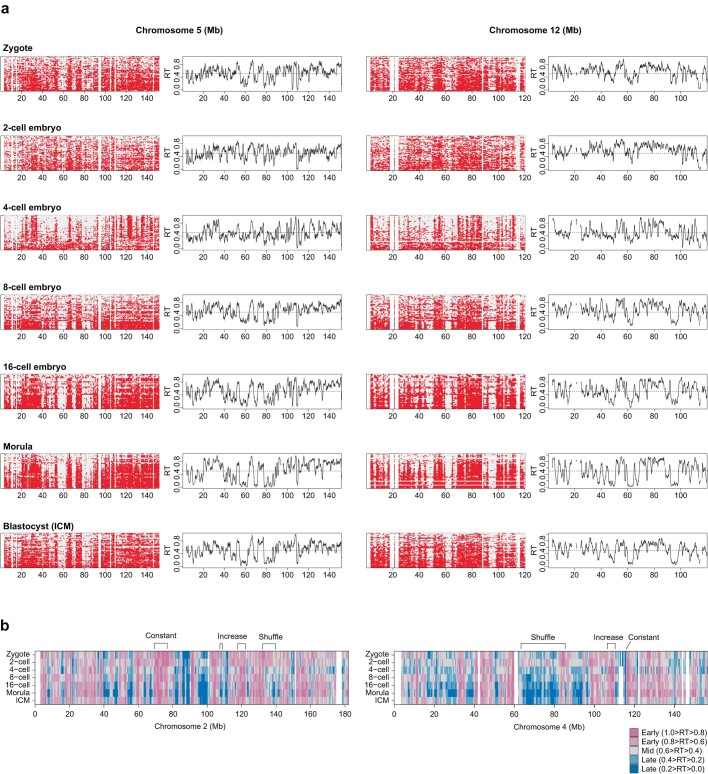
Extended Data Fig. 2. Heatmaps of replication status and RT profiles of preimplantation embryos over a representative region on Chromosome 5 and 12.
a. Cells are ranked by their replication score. The black line indicates RT profiles calculated as the average of overlapping intervals defined by the genome-wide replication score. b. Comparison of RT values in bins of 50 kb across embryonic stages. Representative changes in the RT (increase, shuffle, and constant) are indicated. White regions are regions of no coverage in the corresponding sample.

