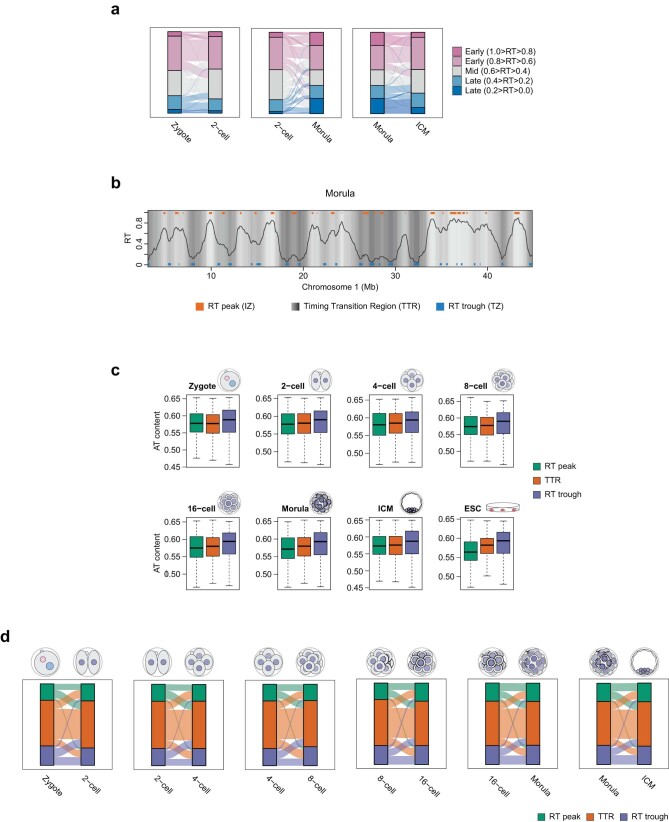
Extended Data Fig. 3. Dynamics of RT peaks, TTRs, and RT troughs during preimplantation development.
a. Alluvial plot showing the changes of RT phases. RT values were categorised in 5 groups from the earliest (1.0 ≥ RT > 0.8) to latest RT (0.2 > RT ≥ 0.0) across the genome. b. Representative replication timing profile in the morula stage depicting RT peaks, TTRs, and RT troughs. Grey shading represents 15 clusters of the RT values that were used to call local maxima (RT peaks or IZs) or local minima (RT troughs or TZs). Regions in transition between RT peaks and RT troughs were called as TTRs. The line indicates RT values. c. Fraction of A + T nucleotides in RT peaks, TTRs, and RT troughs during preimplantation development. Box plots show median and the interquartile range (IQR), whiskers depict the smallest and largest values within 1.5 ×IQR. d. Alluvial plot showing the relative changes of RT peaks, TTRs, and RT troughs at each cell division during preimplantation development. Box plots show median and the interquartile range (IQR), whiskers depict the smallest and largest values within 1.5 ×IQR.

