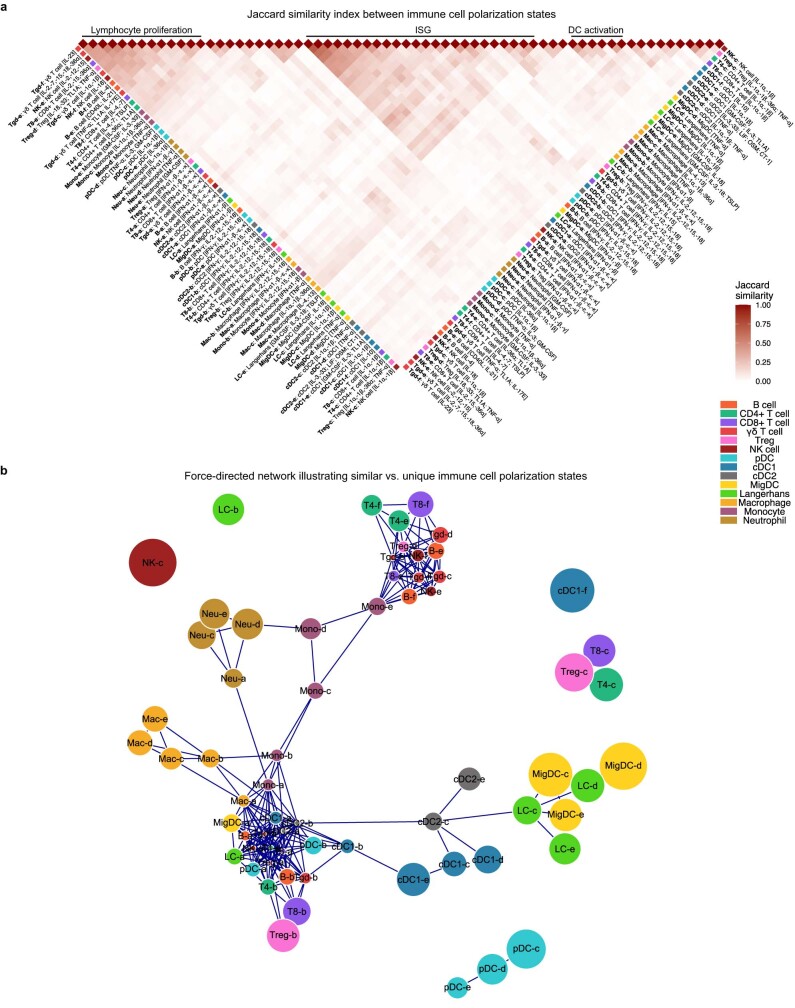
Extended Data Fig. 9. A comparative global view of the 66 major polarization states across immune cell types.
a, Heatmap showing pairwise Jaccard similarity index between immune cell polarization states defined in Fig. 3, Extended Data Figs. 5–8, and Supplementary Figs. 2–11. Jaccard similarity index is defined based on genes with >0.5 log2 fold difference in each polarization state compared to PBS-treatment of the same cell type. Cell types are marked by colors on the edges of the heatmap. Cytokine drivers are indicated in square brackets. Groups of similar polarization states are annotated above the heatmap. b, Force-directed graph visualization of Jaccard similarity index between immune cell polarization states to highlight unique polarization states. Vertices represent polarization states. A line connects a pair of vertices that have Jaccard similarity index > 0.15. Unconnected states are randomly positioned in the force-directed graph. A larger circle represents a more unique polarization state, based on a lower median Jaccard similarity index with other polarization states. Cell types are marked by colors indicated in a.

