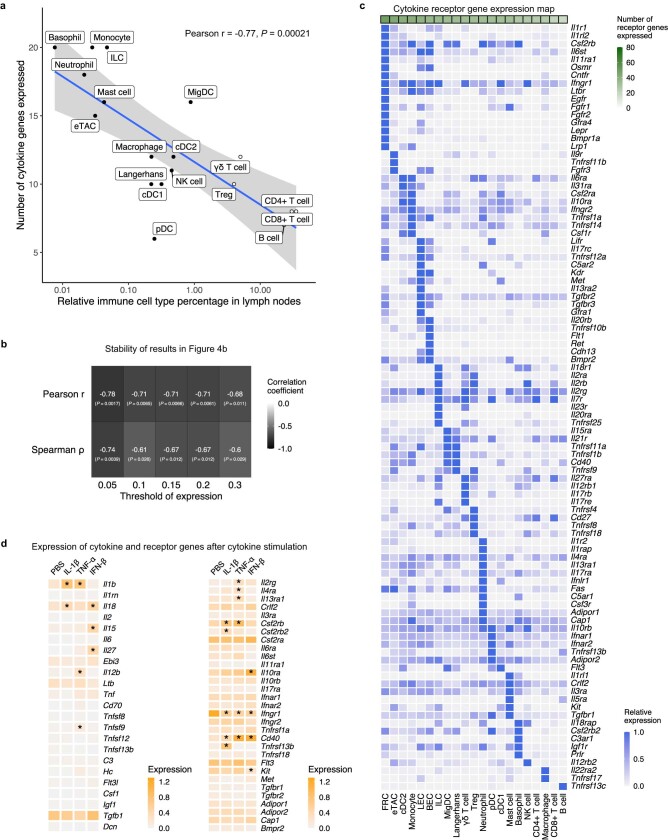
Extended Data Fig. 10. A map of cytokine receptor expression by cell type and additional information on the cytokine production map.
a, Correlation between cell type abundance and number of distinct cytokine genes expressed; added B cells and T cells (hollow circles) to Fig. 4b. B cell and T cell abundances are estimates integrated from literature, all other cell types are obtained from PBS-treated conditions in lymph nodes from our dictionary. Smoothed conditional means and 95% confidence intervals from a fitted linear model are shown. b, Robustness analysis for Fig. 4b; showing correlations between the abundance of each cell type and the numbers of distinct cytokine genes expressed in the cell type under various cutoff thresholds for a cytokine gene to be considered expressed. Both Pearson and Spearman correlation coefficients are shown. c, A map of cytokine receptor expression by cell type. The map includes signaling receptors, decoy receptors, as well as receptors that form complexes with cytokines. The values are normalized to the maximum expression in each row. d, Expression of cytokine (left) or receptor (right) genes in cDC1s following PBS or cytokine treatment. * represents FDR-adjusted P < 0.05 for significant change in expression relative to PBS control.

