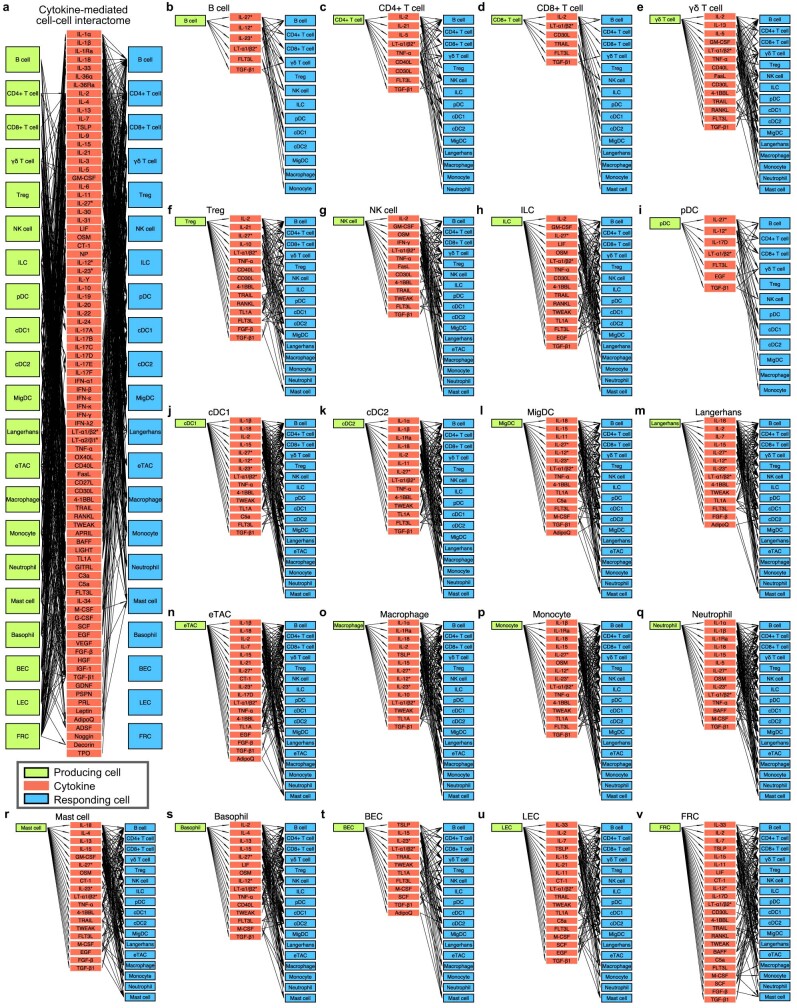
Extended Data Fig. 11. A draft network of cytokine-mediated cell-cell interactome.
a, An interactome network showing cell-cell communication potential based on cytokine expression and the impact of cytokine on each cell type. Lime box, source nodes or cell types secreting cytokines; red box, cytokines mediating the communication; blue box, sink nodes or cell types responding to cytokines. A path is established between source and sink cell types through a cytokine if the source cell type produces the cytokine (normalized expression > 0.1) and the sink cell type shows a significant response to the cytokine (>10 DEGs in the cytokine signatures). Asterisks indicate heteromeric cytokines or cytokine complexes. Rare cell types, including basophils, BECs, LECs, and FRCs, were not analyzed for the response, but were aggregated across treatment conditions to generate the production map. b-v, The interactome using same conventions as in a plotted separately by source node for ease of visualization, shown for b, B cell; c, CD4+ T cell; d, CD8+ T cell; e, γδ T cell; f, Treg; g, NK cell; h, ILC; i, pDC; j, cDC1; k, cDC2; l, MigDC; m, Langerhans cell; n, eTAC; o, macrophage; p, monocyte; q, neutrophil; r, mast cell; s, basophil; t, BEC; u, LEC; v, FRC. j and v are reproduced from Fig. 4c.

