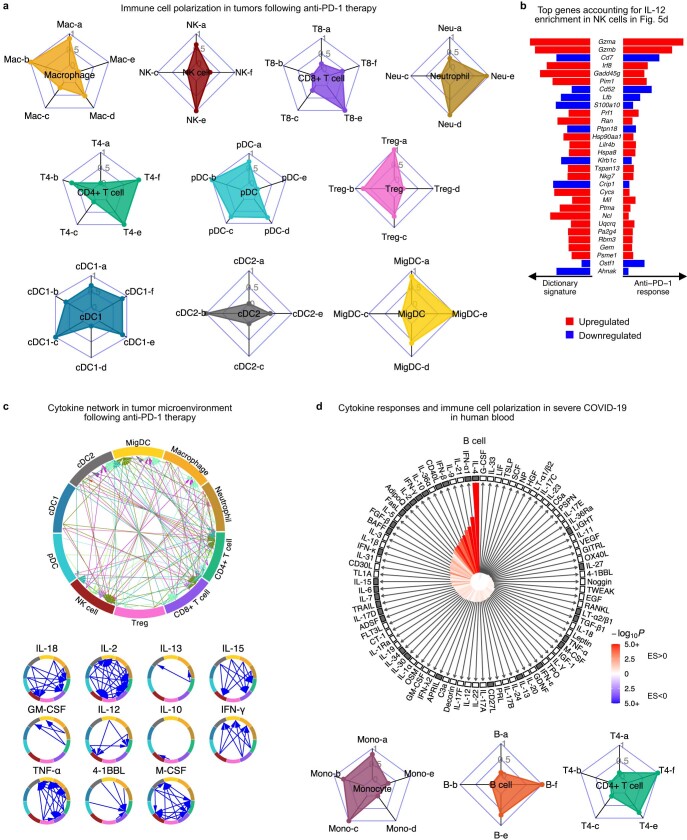
Extended Data Fig. 12. IREA software output on mouse tumor samples following anti-PD-1 treatment and on human blood samples in severe COVID-19.
a-c, Additional IREA analyses on mouse tumor samples following anti-PD-1 treatment relative to the control. a, IREA radar plots showing enrichments of immune cell polarization states described in Fig. 3. b, To improve the interpretability of the enrichment scores in Fig. 5d, top genes contributing to the IL-12 enrichment in NK cells are shown. Bar length represents gene expression fold change; left: changes in gene expression in NK cells in response to IL-12 in the Immune Dictionary; right: changes in gene expression in NK cells after anti-PD-1 treatment in the tumor dataset (red: upregulated relative to control; blue: downregulated relative to control). c, Inferred cell-cell communication network mediated by cytokines. The plot on the top is reproduced from Fig. 5e for ease of reference. Individual cytokine plots following the same visualization scheme are shown below. d, IREA analysis on peripheral blood cells collected from severe COVID-19 patients relative to healthy volunteers. Top, IREA compass plot showing enrichment scores for each of the 86 cytokines in B cells. Bar length represents enrichment score, shade represents FDR adjusted P-value (two-sided Wilcoxon rank-sum test), with darker colors representing more significant enrichment (red: enriched in ventilated COVID-19 patients, blue: enriched in healthy control). Cytokines with receptors expressed are indicated by black filled boxes. Bottom, IREA radar plots showing enrichments of immune cell polarization states in monocytes, B cells, and CD4+ T cells. The reference polarization states are described in Fig. 3.

