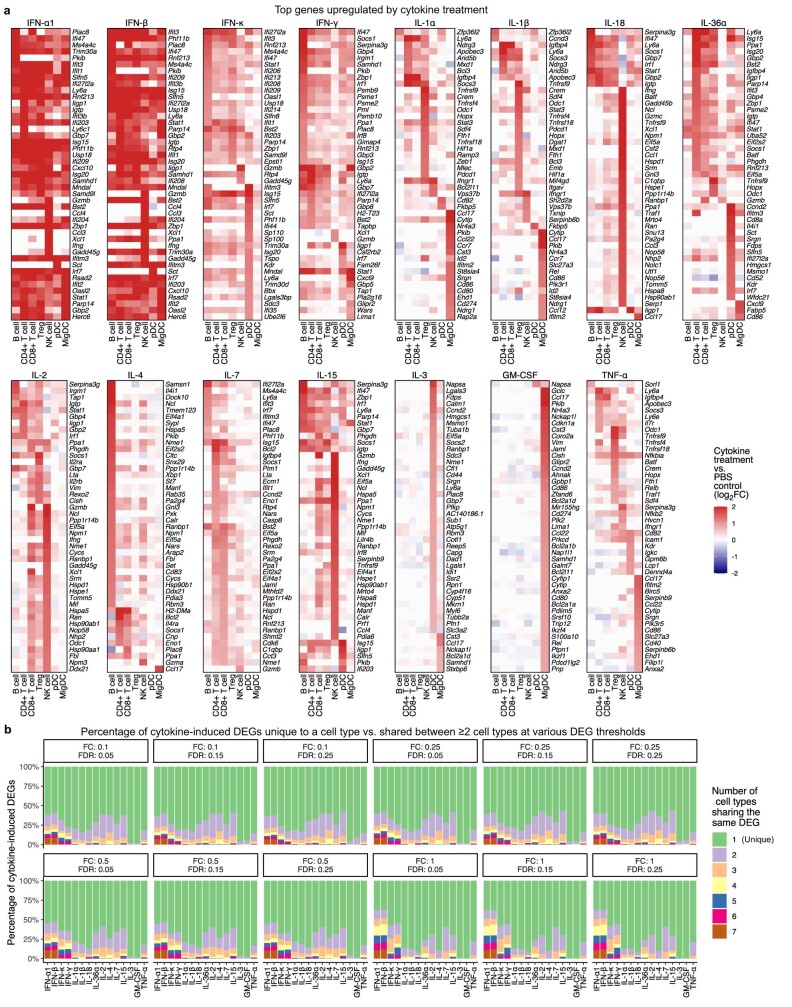
Extended Data Fig. 3. Cell type-specific gene expression changes induced by IFN-α1, IFN-β, IFN-κ, IFN-γ, IL-1α, IL-1β, IL-18, IL-36α, IL-2, IL-4, IL-7, IL-15, IL-3, GM-CSF, and TNF-α.
a, Gene expression heatmaps illustrating top genes upregulated by cytokine treatment compared to PBS treatment in any of the cell types shown. All genes shown have at least log2FC > 0.3 and FDR < 0.05 in one or more cell types. Color gradient indicates average log2FC relative to PBS treatment of the same cell type. Genes expressed in fewer than 10% of cells in both cytokine and PBS treatment conditions are denoted as no change. b, Percentage of upregulated DEGs exclusive to a single cell type (green) or shared among two or more cell types (other colors) after cytokine treatment at various DEG cutoff thresholds. Each box shows a different log2FC and FDR threshold for defining DEGs. This is an extension of the analysis in Fig. 2b, showing consistency of the cell type-specific effects irrespective of DEG cutoffs.

