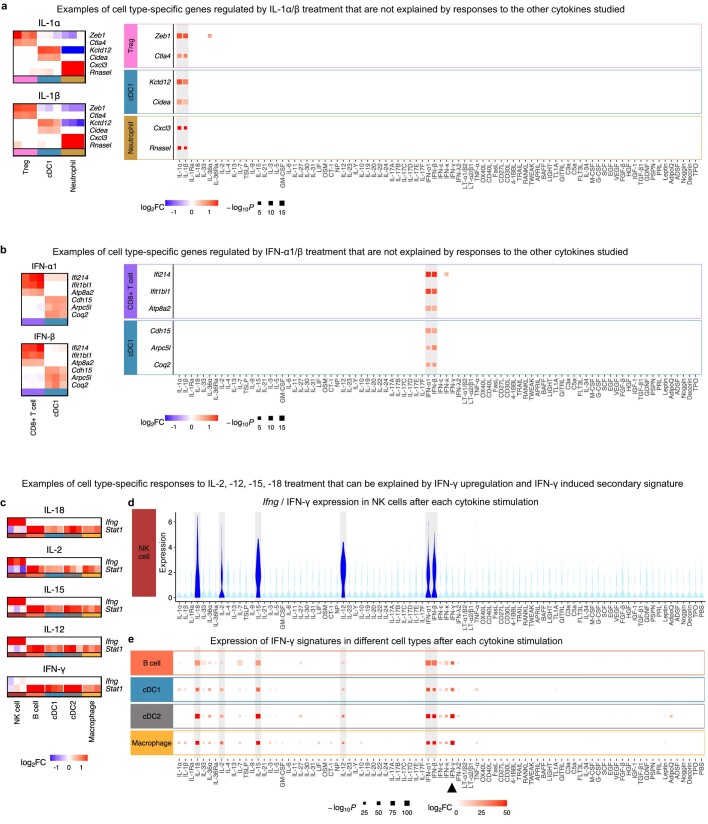
Extended Data Fig. 4. Cell type-specific responses to a cytokine can be exclusive to the cytokine or can be attributed to secondary effects from induced cytokines.
a-b, Examples of cell type-specific responses to a cytokine that are not observed in the responses to the other cytokines studied. a, Examples of cell type-specific gene regulation in response to IL-1α/β and exclusively to IL-1α/β. Left, Heatmaps showing differential expression of IL-1α/β-regulated genes relative to PBS treatment per cell type, highlighting cell type-specific responses to the same cytokines. Three independent mice for each cytokine treatment are shown in adjacent columns. Right, for the IL-1α/β-induced cell type-specific DEGs in the heatmaps, the plots show whether they can be induced by any other of the 86 cytokine stimulations. Color of square, log2 fold change in each cytokine treatment relative to PBS; size of square, –log10 transformed FDR-adjusted P-value obtained from two-sided Wilcoxon rank-sum test. Results with FDR < 0.05 and log2FC > 0.5 are shown. IL-1α/β treatments are highlighted in gray. Cell types in columns on the left and rows on the right follow the same color code. Note that both IL-36α and IL-1α/β are proinflammatory cytokines in the IL-1 cytokine family. b, Examples of cell type-specific gene regulation in response to IFN-α1/β and exclusively to IFN-α1/β; following the same visualization as in a. Note that both IFN-κ and IFN-α1/β are type I interferons and share receptors. c-e, Examples of cell type-specific responses to a cytokine that can be attributed to secondary effects from induced cytokines. c, Heatmaps showing DEGs in response to IL-2, IL-12, IL−15, IL−18 relative to PBS treatment, highlighting different responses to the same cytokine in NK cells vs. other cell types. Heatmap for IFN-γ treatment is included as a comparison. Stat1 is known to be regulated by IFN-γ signaling. d, Violin plot showing Ifng gene expression in NK cells after each of the 86 cytokine treatments or PBS treatment. Samples with a high expression (>0.8 normalized expression units) are colored dark blue. e, Induction of IFN-γ signatures across cell types after each cytokine treatment. The IFN-γ signature is obtained for each cell type from the IFN-γ treatment. Expression of the signature is obtained from summing normalized expression units of all genes in the signature for each cell type. Significant (FDR < 0.01) responses are shown as squares, with color gradient representing average log2FC in each cytokine treatment relative to PBS (capped at 50), and size representing –log10 transformed FDR-adjusted P-value obtained from two-sided Wilcoxon rank-sum test. Cytokines inducing a high expression of Ifng are highlighted in gray in d and e. d and e are vertically aligned to illustrate that the cytokine treatments inducing an upregulation of Ifng in NK cells display a strong IFN-γ signature in other cell types.

