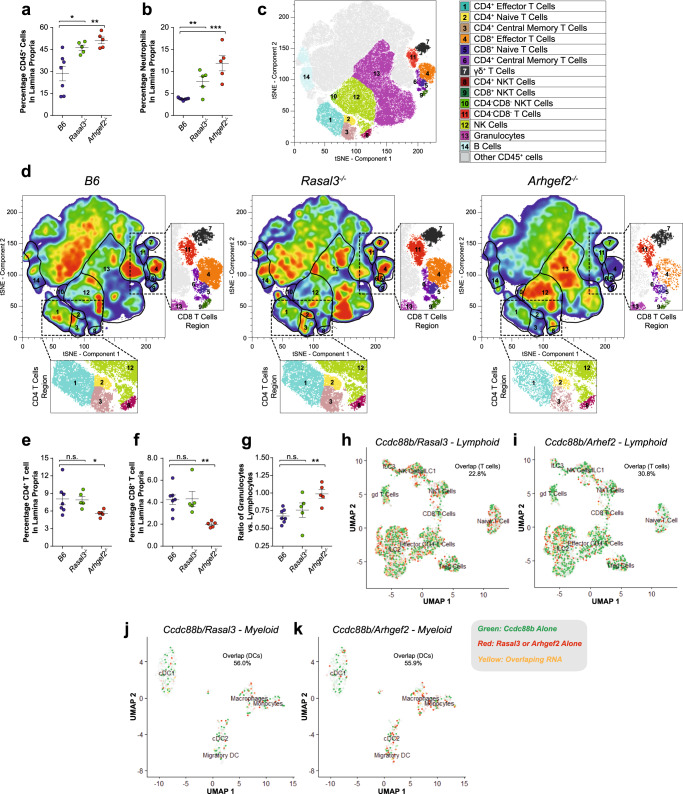
Fig. 5. Cellular infiltrate in the lamina propria of RASAL3−/− and ARHGEF2−/− mice following DSS-induced colitis.
Control B6, as well as Rasal3−/− and Arhgef2−/− mutant mice were given 3% DSS for 5 days followed by 3 days of water and were then sacrificed. a, b Percentage of total CD45+ cells and neutrophils in the lamina propria from B6, Rasal3−/− and Arhgef2−/− mice colon at day 8 following DSS treatment, respectively (mean ± SEM; n.s. non-significant, *p < 0.05, **p < 0.01, ***p < 0.001; two-tailed Student’s t test). c tSNE-based visualization of the different CD45+ cell populations found in the lamina propria, colored and numbered as per the legend (pooled analysis from all genotypes). d Same visualization as in (c), but for B6 (left), Rasal3−/− (middle) and Arhgef2−/− (right) mice colon at day 8 following DSS treatment, with the highest cellular density in red. Inserts depict regions of the tSNE plots corresponding to the CD8 and CD4 T cells clusters. e, f Percentage of CD4+ and CD8+ T cells from (d), respectively (mean ± SEM; *p < 0.05, **p < 0.01; two-tailed Student’s t test). g Ratio of total number of granulocytes vs. total number of lymphocytes from (d) (mean ± SEM; n.s. non-significant, **p < 0.01; two-tailed Student’s t test). tSNE-based visualization of single-cell RNAseq data from B6 lamina propria cells obtained at steady state for indicated lymphoid (h, i) and myeloid (j, k) populations. Expression of Ccdc88b is indicated in green and level of expression of either Rasal3 (h, j) or Arhgef2 (i, k) in red, as indicated in the legend. Indicated percentages represent the fraction of cells co-expressing RNA for Rasal3 or Arhgef2 with Ccdc88b, for the indicated populations.

