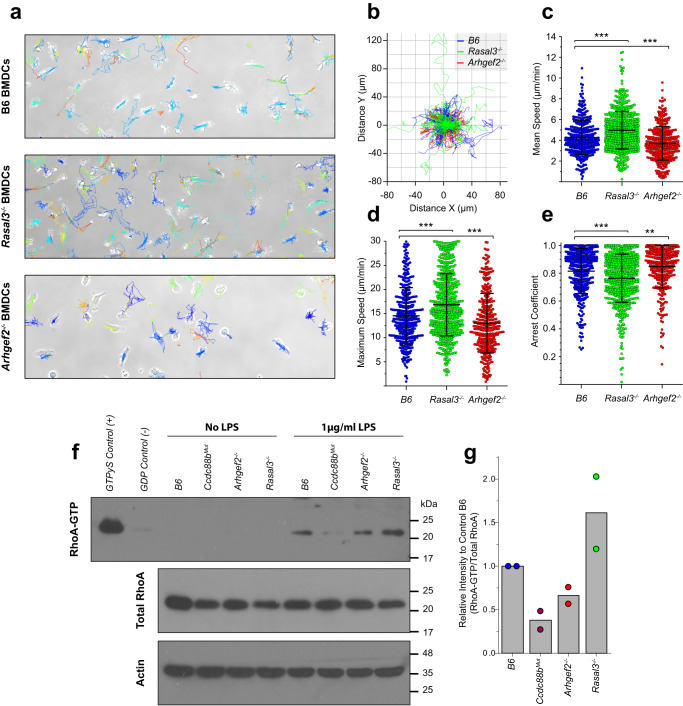
Fig. 7. Altered motility parameters of Rasal3−/− and Arhgef2−/− dendritic cells.
BMDCs generated from B6, Rasal3−/− and Arhgef2−/− mutants were imaged by bright-field time-lapse microscopy for 90 min and tracked using the TrackMate plugin from the ImageJ software, with manual correction. a Representative field of view of B6, Rasal3−/− and Arhgef2−/− BMDC cultures with the tracking results over the course of the experiment. b Normalized Rose plot depicting 25 randomly chosen track of individual B6 controls (blue), Rasal3−/− (green) or Arhgef2−/− (red) DCs. c Average velocity of individual BMDCs from control B6, Rasal3−/− and Arhgef2−/− DCs mutants (means ± SD, ***p < 0.001; two-tailed Student’s t test). d Maximum speed reached by individual DCs (means ± SD, ***p < 0.001; two-tailed Student’s t test). e Arrest coefficient using a threshold of 7 µm/min for actively patrolling DCs (means ± SD, **p < 0.01, ***p < 0.001; two-tailed Student’s t test). Data from (a) to (e) were processed using a homemade MatLab script and are representative of three independent experiments, taking at least two separated field of view (0.314 mm2 per field of view) per DCs culture. f BMDCs from B6, Ccdc88bMut, Rasal3−/− and Arhgef2−/− mutants were stimulated with LPS and protein lysate analyzed for the level of active RhoA-GTP using Rhotekin-RBD (Rho Binding Domain) beads. As control, some BMDCs were loaded with high concentration of non-hydolyzable GTP (GTPγS, positive control) or GDP (negative control) prior to pull-down. g Quantification of (f), normalized to the total amount of RhoA expression, for two independent experiments.

