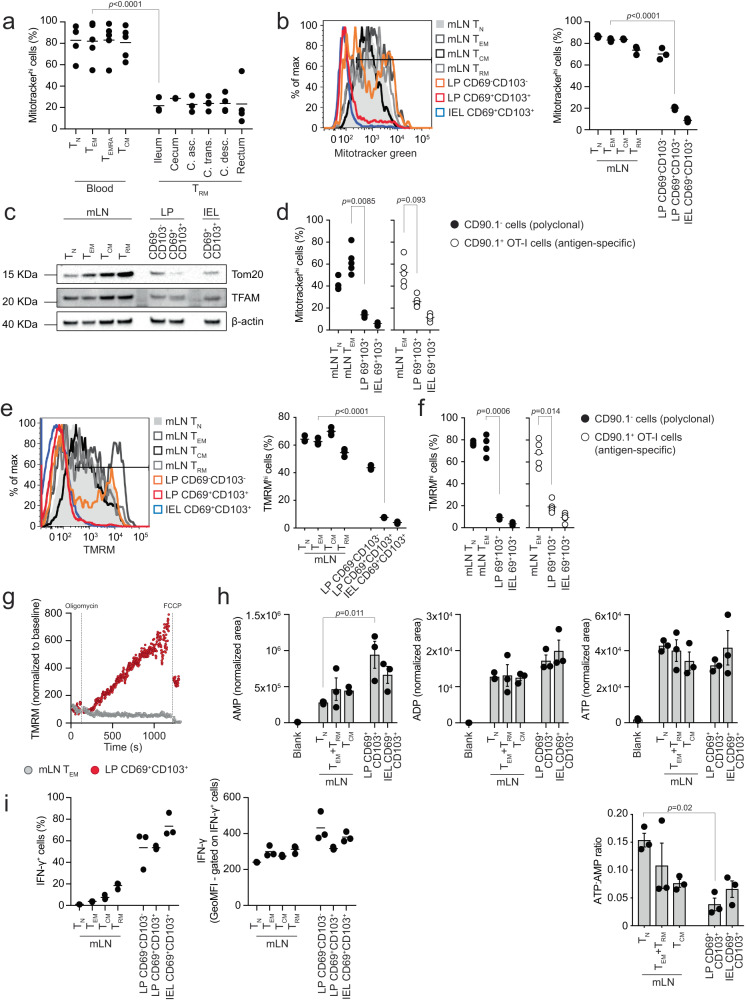
Fig. 2. Intestinal LP and IEL T cells have reduced mitochondrial content.
a Flow cytometry analysis of Mitotracker green in cell populations from blood and intestine of healthy humans. Lines in the dot plot show mean values and graph shows data from 2 to 5 independent experiments. b Mitotracker green in cell populations isolated from mLN and intestine of C57BL/6J mice. Lines in the dot plot show mean values and data show n = 3 biological replicates over nine independent experiments. c Western blot of Tom20 and TFAM. The data shown are representative of six independent experiments. d Mitotracker green in antigen-specific and polyclonal cell populations isolated from mLN and intestine of mice orally challenged with LmOVA and analyzed 7 days post-infection. Lines in the dot plot show mean values and data show n = 5 biological replicates over four independent experiments. e TMRM staining in the indicated cell populations. Lines in the dot plot show mean values and data show n = 3 biological replicates over five independent experiments. f TMRM in antigen-specific and polyclonal cells isolated from mLN and intestine of mice orally challenged with LmOVA and analyzed 7 days post-infection. Lines in the dot plot show mean values and data show n = 5 biological replicates over four independent experiments. g TMRM staining in cells upon treatment with oligomycin and FCCP. TMRM was used at a concentration of 10 nM. TMRM values are shown normalized to the baseline of staining in the respective population. Data are representative of three independent experiments. h Mass spectrometry analysis of AMP, ADP, ATP, and ATP:AMP ratio. The bars show mean ± SEM. Data show three independent experiments analyzed simultaneously. i Intracellular interferon-γ (IFN-γ) protein expression in cells isolated from mLN and intestine of GREAT mice. Lines in the dot plots show mean values and data show n = 3 biological replicates over two independent experiments. a, b, d–f, and h Statistics were performed using one-way ANOVA and Tukey’s multiple comparison correction. Source data are provided as a Source Data file.

