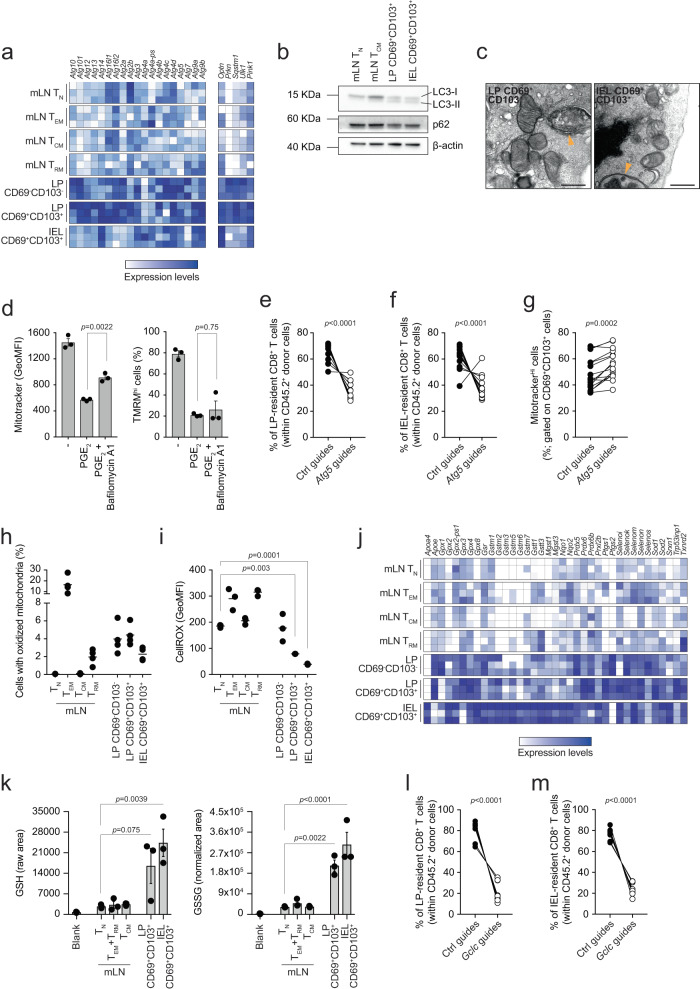
Fig. 4. Autophagy and glutathione maintain the fitness of LP and IEL T cells.
a, j Heatmaps show the expression of selected genes of bulk RNA sequencing data. Color-coding is as per legend (white, low expression; blue, high expression) and shows relative values within each gene. Data show three independent experiments. b Western blot of LC3 isoforms and p62. The data are representative of two independent experiments (LC3) or one experiment (p62). c Transmission electron microscopy of cells isolated from unchallenged mice. Yellow arrowheads indicate double membrane structures characteristic of autophagosomes. Scale bar = 500 nm. The panel shows representative images of one experiment. d Mitotracker green and TMRM in CD8+ T cells activated in (IL-15/TGF-β)-T cells polarizing conditions for 5 days and treated with PGE2 in the presence of bafilomycin A1. Lines in the dot plot show mean values ± SEM and the data show n = 3 biological replicates over five independent experiments. e–f Distribution of Ctrl vs Atg5-deleted CD8+ T cells within the population of CD45.2+ cells upon LmOVA challenge in LP (e) and IEL fraction (f). Lines in the dot plot show pairing within single mice, and the dot plots show cumulative data of n = 15 biological replicates over three independent experiments. g Mitotracker green in Ctrl vs Atg5-deleted CD69+CD103+ cells isolated from LP of mice orally challenged with LmOVA. Lines in the dot plot show pairing within single mice, and dot plots show cumulative data of n = 15 biological replicates over three independent experiments. h Mitochondrial oxidative state, as indicated by a shift from green to blue fluorescence, in cells isolated from mLN and intestine of Mito-roGFP2-Orp1. Lines in the dot plot show mean values and the data show n = 4 biological replicates over two independent experiments. i CellROX staining. Lines in the dot plot show mean values and the data show n = 3 biological replicates over three independent experiments. k Mass spectrometry analysis of levels of GSH and GSSG in the indicated cell populations. The bars show mean ± SEM. Data show three independent experiments analyzed simultaneously. l–m Distribution of Ctrl vs Gclc-deleted CD8+ T cells within the population of CD45.2+ cells upon LmOVA challenge in LP (l) and IEL fraction (m). Lines in the dot plot show pairing within single mice, and the data show n = 8 biological replicates over two independent experiments. d, h, i and k Statistics were performed using one-way ANOVA and Tukey’s multiple comparison correction. e–g, l, m Statistics were performed using two-tailed paired t test. Source data are provided as a Source Data file.

