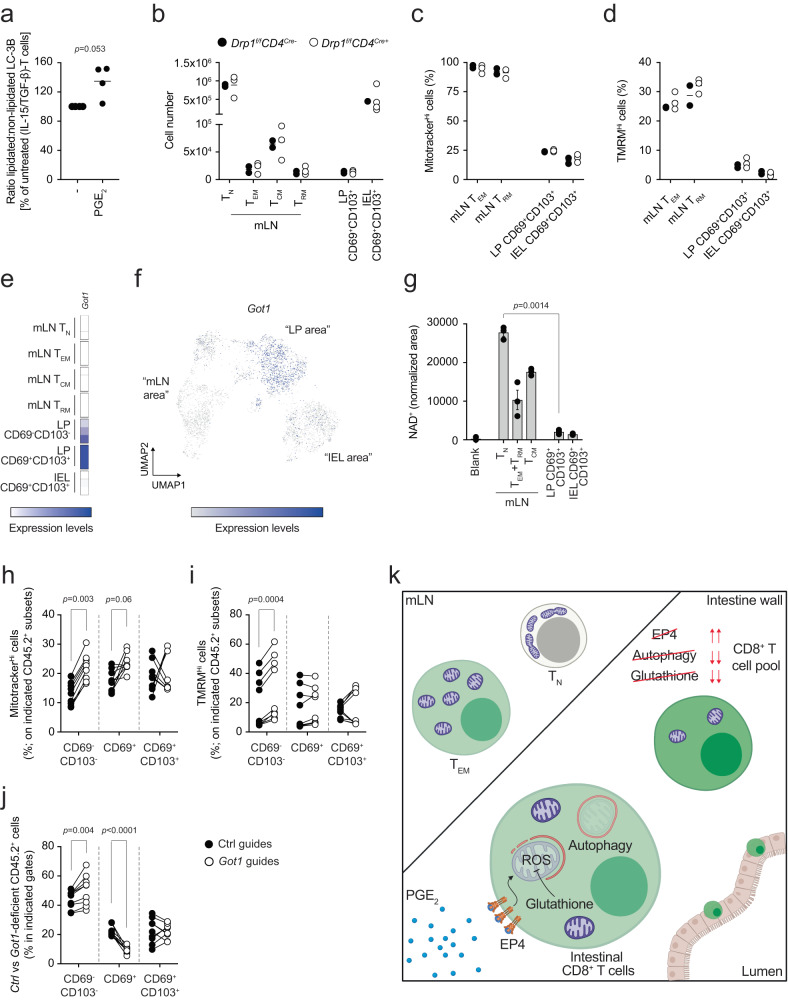
Fig. 5. Got1 links PGE2 with the regulation of mitochondrial content in intestinal LP and epithelial CD8+ T cells.
a Western blot of LC3-I and LC3-II in (IL-15/TGF-β)-T cells cultured for 6 days and treated for 24 h with or without 100 nM PGE2. Dot plot shows quantification by densitometry. Lines in dot plots show mean values. Dot plots show cumulative data of n = 4 biological replicates over two independent experiments. Statistics were performed using two-tailed paired t test. b Cell numbers of CD8+ T cells subsets in mLN, LP and IEL of Drp1fl/flCD4Cre+ and Drp1fl/flCD4Cre− mice. Lines in the dot plot show mean values and the data show n = 2–4 biological replicates over two independent experiments. c, d Mitotracker green and TMRM in cells from mLN and intestine of Drp1fl/flCD4Cre+ and Drp1fl/flCD4Cre− mice. Lines in the dot plot show mean values and the data show n = 2–4 biological replicates over two independent experiments. e Heatmaps show the expression of Got1 in bulk RNA sequencing data obtained from the indicated cells. Color-coding is as per legend (white, low expression; blue, high expression) and shows relative values within the Got1 gene. Data show three independent experiments. f UMAP of the single cell RNA and ADT sequencing data showing expression across different clusters of Got1. g Mass spectrometry quantification of NAD+ in the indicated cells. The bars show mean ± SEM. Data show three independent experiments analyzed simultaneously. Statistics were performed using one-way ANOVA and Tukey’s multiple comparison correction. Mitotracker green (h) and TMRM (i) in Ctrl vs Got1-deleted CD69−CD103−, CD69+ and CD69+CD103+ cells isolated from LP of mice orally challenged with LmOVA. Lines in the dot plot show pairing within single mice, and dot plots show cumulative data of n = 9 biological replicates over two independent experiments. j Distribution of Ctrl vs Got1-deleted CD8+ T cells gated in the population of CD45.2+ cells between CD69−CD103−, CD69+ and CD69+CD103+ populations, upon LmOVA challenge in LP. Lines in the dot plot show pairing within single mice; dot plots show cumulative data of n = 9 biological replicates over two independent experiments. k After activation CD8+ T cells migrate and enter the intestine. Here, they sense PGE2 via the EP4 receptor. PGE2 drives the reduction of mitochondrial membrane potential, in part via alteration of the malate-aspartate shuttle, and leads to drop in mitochondrial mass. Autophagy contributes to the clearance of depolarized mitochondria, whereas glutathione maintains the redox balance by scavenging mitochondrial ROS, to ultimately shape the pool of CD8+ T cells. Image created with Biorender.com. h–j Statistics were performed using two-way ANOVA and Sidak’s multiple comparison correction. Source data are provided as a Source Data file.

