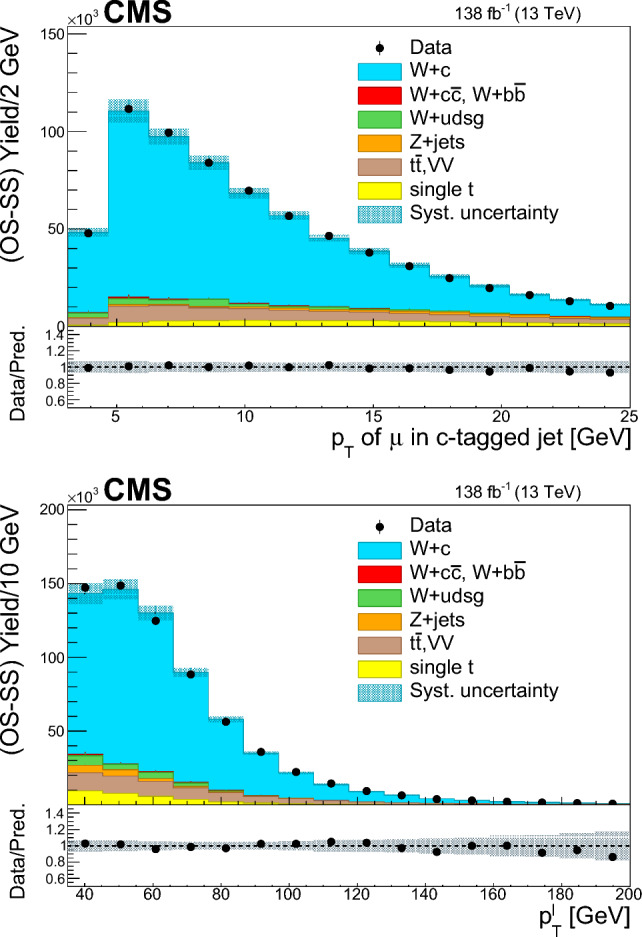
Fig. 2.

Distributions after OS-SS subtraction of the of the muon inside the (upper) and the of the lepton from the W decay (lower) for events in the SL sample, summing up the contributions of the W boson decay channels to electrons and muons. The contributions of the various processes are estimated with the simulated samples. The statistical uncertainty in the data is smaller than the size of the data dots. The hatched areas represent the sum in quadrature of statistical and systematic uncertainties in the MC simulation. The ratio of data to simulation is shown in the lower panels. The uncertainty band in the ratio includes the statistical uncertainty in the data, and the statistical and systematic uncertainties in the MC simulation
