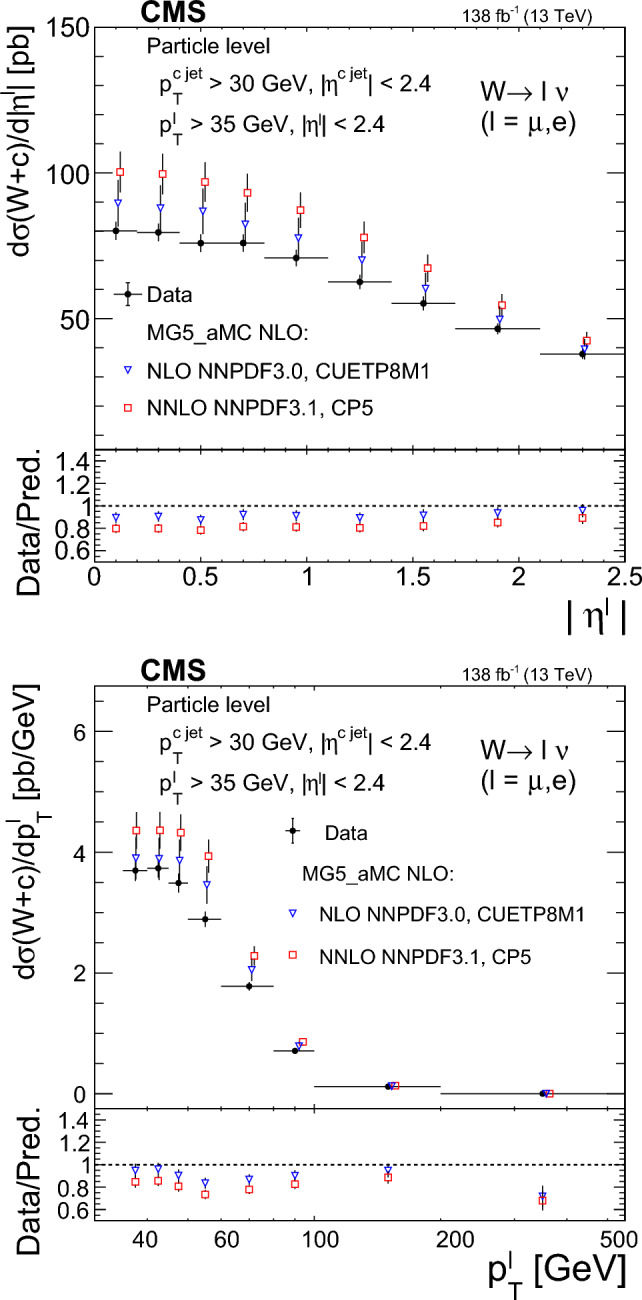
Fig. 5.

Measured differential cross sections (upper) and (lower) unfolded to the particle level, compared with the predictions of the MadGraph5_amc@nlo simulation. Two different PDF sets (NLO NNPDF3.0 and NNLO NNPDF3.1) are used. Error bars on data points include statistical and systematic uncertainties. Symbols showing the theoretical expectations are slightly displaced in the horizontal axis for better visibility. The ratios of data to predictions are shown in the lower panels. The uncertainty in the ratio includes the uncertainties in both data and prediction
