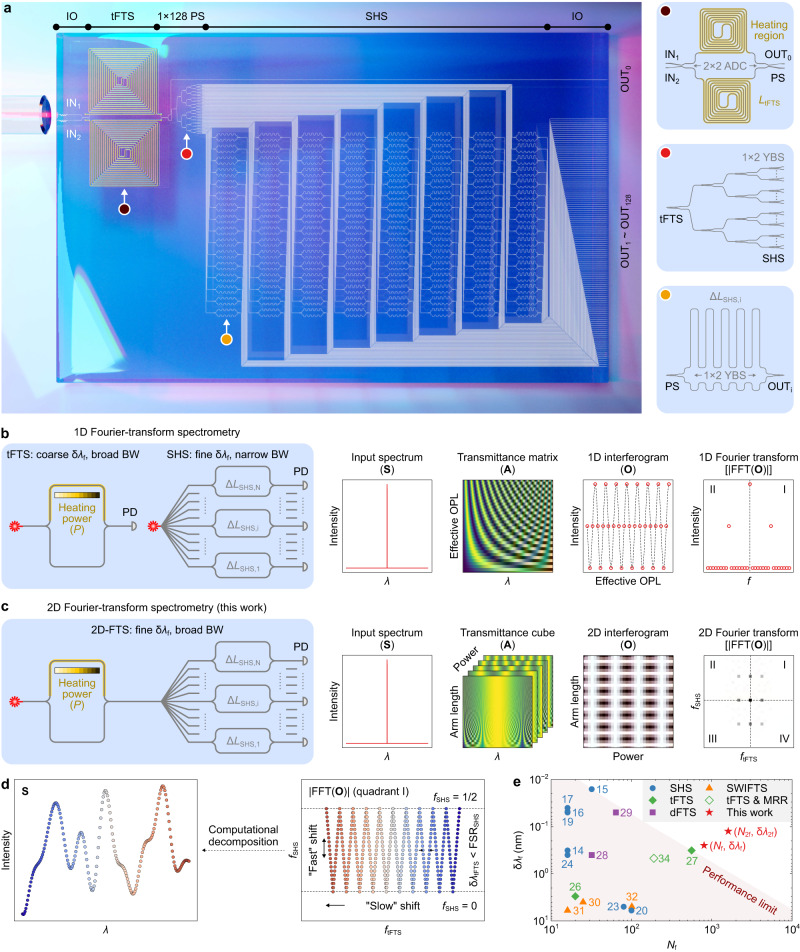
Fig. 1. Principle of the two-dimensional Fourier-transform spectrometer (2D-FTS).
a Schematic layout of the 2D-FTS. The insets show the enlarged views of key components. The 2D-FTS comprises of a tunable Fourier-transform spectrometer (tFTS) and a spatial heterodyne spectrometer (SHS) that are connected via a 1×128 power splitter (PS). The edge couplers are utilized as input and output (IO) ports, i.e., INi and OUTi. Conceptual illustrations of the b 1D and c 2D Fourier-transform spectrometry. For a stand-alone tFTS/SHS, the period of the sinusoidal response is tuned by changing the heating power (P) or arm-length difference (ΔLSHS). At a single wavelength (λ), the interferogram (O) is a 1D sequence sliced from a 2D transmittance matrix (A). The 1D fast Fourier transform (FFT) of the interferogram contains a peak in each quadrant. For the 2D-FTS, A is a 3D cube with variations of both P and ΔLSHS. Hence, the interferogram is a 2D diagram that is modulated along two axes. By applying 2D FTT, each wavelength is mapped to a single spot in the Fourier domain. d Reconstruction principle. The intensity information of a continuous spectrum (S) is encoded by a cluster of spots in FFT(O). At varying wavelengths, the spot location shifts “slowly” along ftFTS and “fast” along fSHS. Here, ftFTS and fSHS denote the Fourier frequencies. The shift direction relies on the phases of sinusoidal responses. Any spectrum can be retrieved via decomposition, as long as the resolution (δλtFTS) of the tFTS is finer than the free spectral range (FSRSHS) of the SHS, thereby breaking the inherent limit between the resolution (δλf) and bandwidth (BW). e Comparison of integrated FTSs in terms of the channel capacity (Nf) and δλf at the Rayleigh criterion. δλf and Nf can be improved to δλ2f and N2f using computational methods. OPL, optical path length. ADC, adiabatic directional coupler. YBS, Y-branch splitter. PD, photodetector. MRR, microring resonator. dFTS, digital FTS. SWIFTS, stationary-wave integrated FTS.

