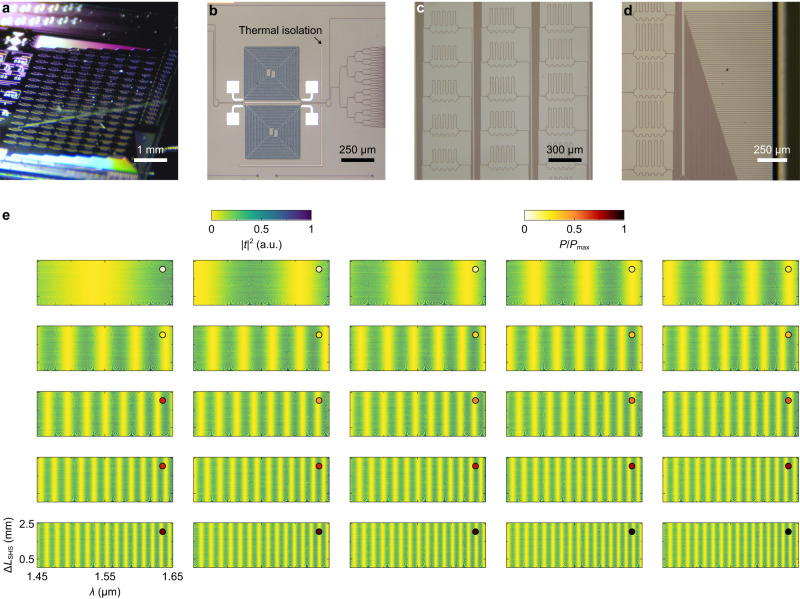
Fig. 3. Characterization of the spectrometer.
Microscope images of the fabricated a photonic chip, b tunable Fourier-transform spectrometer, c spatial heterodyne spectrometer, and d inverse-taper edge couplers. e Measured transmittance (|t|2) cube. The cube is sliced into the matrices with varying heating power (P), represented by the colors of dots in the upper right corner. Each matrix contains transmittances with varying arm-length differences (ΔLSHS) and wavelengths (λ).

