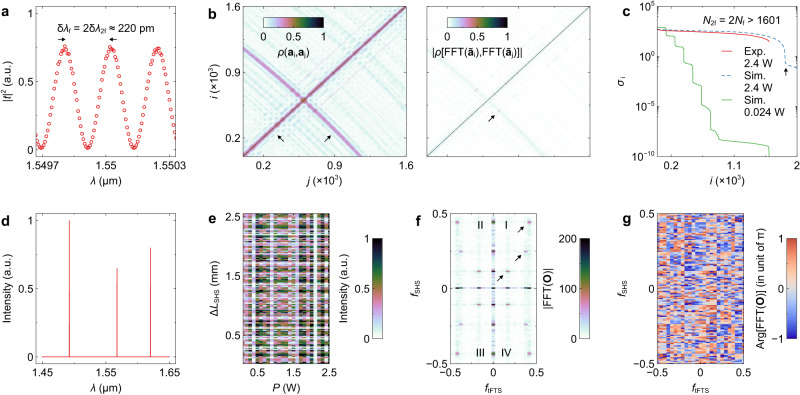
Fig. 4. Analysis of the spectrometer.
a Measured transmittance (|t|2) at OUT128 and varying wavelengths (λ). Here, zero electric power was applied to the heater. At the Rayleigh criterion, the resolution is δλf = 2δλ2f ≈ 220 pm at λ ≈ 1.55 μm. b Correlation matrices derived from the transmittance cube. On the left panel, the correlation [ρ(·, ·)] is performed between the fringes (ai) at different λ. The arrows highlight the high-correlation non-diagonal elements. The right panel shows the correlation of the fast Fourier transform (FFT) of fringes (ãi) with zero-frequency components removed. The arrow highlights the remnant non-diagonal elements with relatively high correlations. c Singular values (σi) derived from the calculated and measured cube with the heating power of 2.4 W and 0.024 W. The arrow highlights the kink. The capacity of N2f = 2Nf = 1601 is verified. d Testing spectrum (S) with three spikes. e Interferogram (O) derived from the measured cube and testing spectrum. f Intensity and g phase maps of FFT(O). The arrows highlight the three spots that are associated with the three spikes.

