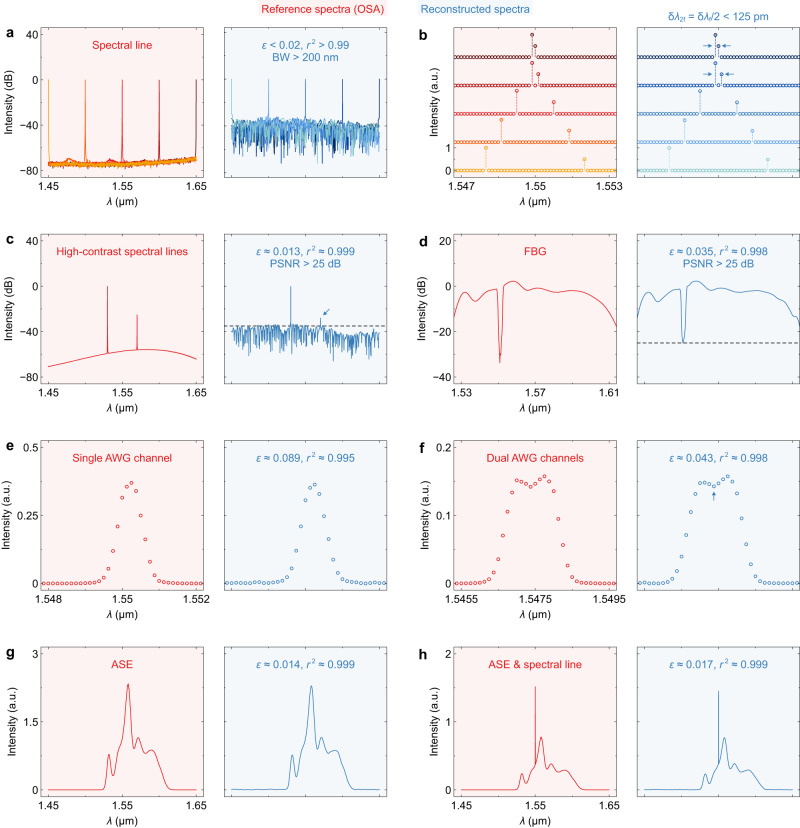
Fig. 5. Spectrum reconstruction.
Reconstruction results of the a single spectral lines, b dual spectral lines, c high-contrast spectral lines, d response of a fiber Bragg grating (FBG), e response of a single channel of an arrayed waveguide grating (AWG), f response of dual channels of an AWG, g amplified spontaneous emission (ASE), and h ASE with a spectral line superimposed. The reference and reconstructed spectra are shaded in red and blue, respectively. The reference spectra were measured using a commercial optical spectrum analyzer (OSA), while the reconstructed spectra are derived from the measured interferograms (see Supplementary information, Note 9, Figs. S19 and S20). The relative errors (ε) and coefficients of determination (r2) are also labeled. In Fig. 5c, d, the dashed lines show the intensity levels of ≈ –35 dB and ≈ –25 dB, respectively. The peak signal-to-noise ratio is characterized to be PSNR > 25 dB. The demonstrated resolution and bandwidth are δλ2f = δλf/2 < 125 nm and BW > 200 nm, respectively.

