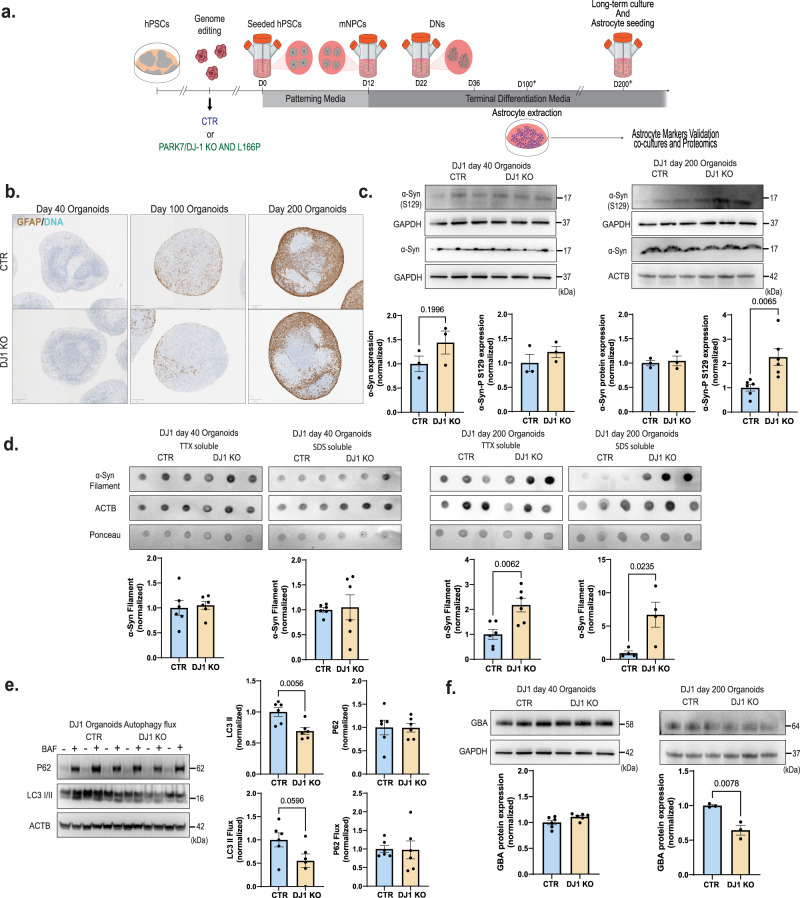
Fig. 1. DJ1 KO human midbrain organoids α-syn and autophagy phenotypes.
a Micrography GFAP staining of CTR and DJ1 KO day 40, 100, and 200 midbrain organoids. b Midbrain differentiation and astrocytes extraction protocol schematic. c Immunoblots for α-syn, phospho-α-syn (S129) (n = 3, Two-tailed t-test), and corresponding loading controls actin (ACTB) and GAPDH for CTR and DJ1 KO day 40 (α-syn n = 3, phospho-α-syn (S129), n = 3) and day 200 midbrain organoids (α-syn n = 3; phospho-α-syn (S129), n = 6). d Dot blots for oligomeric α-syn and actin (ACTB)/Ponceau loading control for CTR and DJ1 KO day 40 TTX soluble (n = 6); SDS soluble fractions (n = 6) and day 200 TTX soluble (n = 6) and SDS soluble fractions (n = 3) in midbrain organoids. e Immunoblots for LC3 I/II, P62, actin (ACTB) loading control in BAF – and + treated CTR and DJ1 KO day 100 midbrain organoids, graphs report LC3 I/II basal (n = 6), LC3 I/II flux (n = 6), P62 basal (n = 6), P62 flux (n = 6). f Immunoblots for GBA and ACTB/GAPDH loading control for CTR and DJ1 KO day 40 (n = 6) and day 200 (n = 3) midbrain organoids. All data are represented in mean ± S.E.M, data points are individual well differentiation, and the p-value was reported on the graph highlighted comparison. For all the comparisons, a Two-tailed t-test was applied. Panels c and f share the same loading controls. All measurements were taken from distinct samples.

