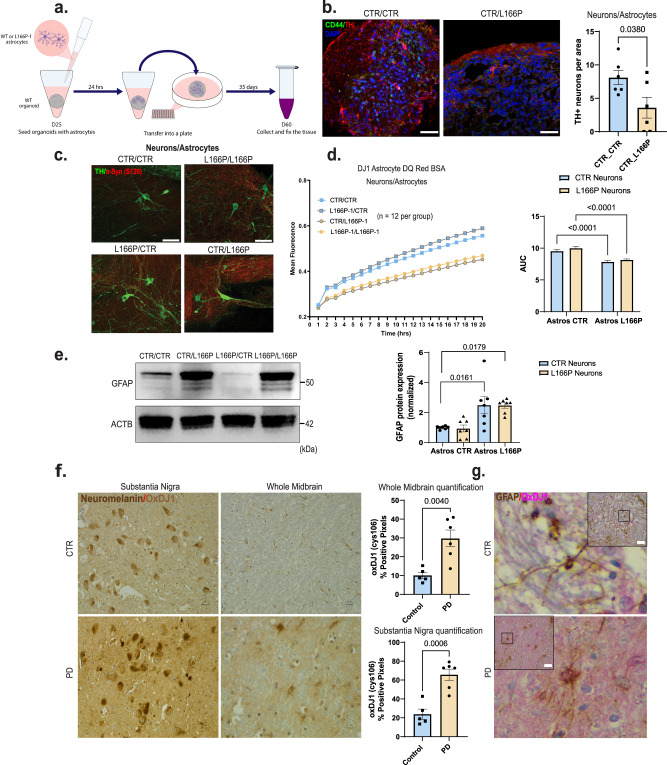
Fig. 3. Astrocyte DJ1 LOF are reactive and produce toxicity in the midbrain.
a Astrocytes seeding procedure schematic. b Images of organoids seeded with astrocytes stained for TH (Red), CD44 (green), and DAPI and quantification of TH+ positive neurons per organoid area (n = 6, Two-tailed t-test was used for mean comparisons). c 40× images of day 50 NPC/Astrocyte co-cultures stained for TH (green), phospho-α-syn (S129) (Red). d DQ BSA proteolysis live imaging in mixed genetic neuron/astrocytes co-cultures (n = 12, Two-way ANOVA followed by Tukey’s for the multiple comparisons test). e Western blot for GFAP and actin (ACTB) loading control for Neurons/Astrocytes co-cultures and quantification (n = 7, Two-way ANOVA followed by Tukey’s for the multiple comparisons test). f 40× micrography of the substantia nigra and midbrain of PD patients and age-matched controls showing OxDJ1 staining in light brown. QuPAth of OxDJ1 positive pixel quantification (CTR n = 5 and PD n = 6, Two-tailed t test was used for mean comparisons). g 40× micrography GFAP positive midbrain astrocytes (brown) and OxDJ1 (red). All data are represented in mean ± S.E.M. Scale bars, 50 µm for (c), (f), and (g); 70 µm for (b). Data points are individual well differentiation or individual patients, and the p-value was reported on the graph highlighted comparison. All measurements were taken from distinct samples.

