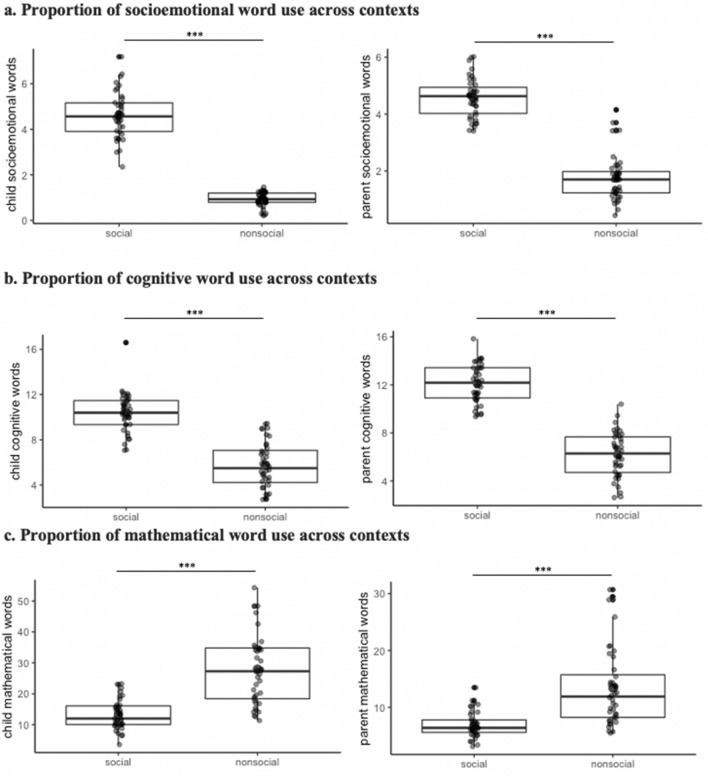
Figure 1.
Proportion of speech produced by parents and child varies based on context. (a) Children, t(44.95) = 21.613, p < .001, d = 4.89, 95% CI = [3.358–4.048]; parents: t(75.88) = 16.62, p < .001, d = 1.93, 95% CI = 2.49–3.16. (b) Children, t(75.84) = 10.87, p < .001, d = 2.44, 95% CI = [3.81–5.52]; parents, t(75.97) = 14.92, p < .001, d = 3.35, 95% CI = [5.12–6.70]. (c) Children, t(53.43) = 7.36, p < .001, d = − 1.65, 95% CI = [10.60–18.54]; parents, t(48.02) = 5.74, p < .001, d = 1.28, 95% CI = [4.19–8.70]. The red dot indicates the group mean.

