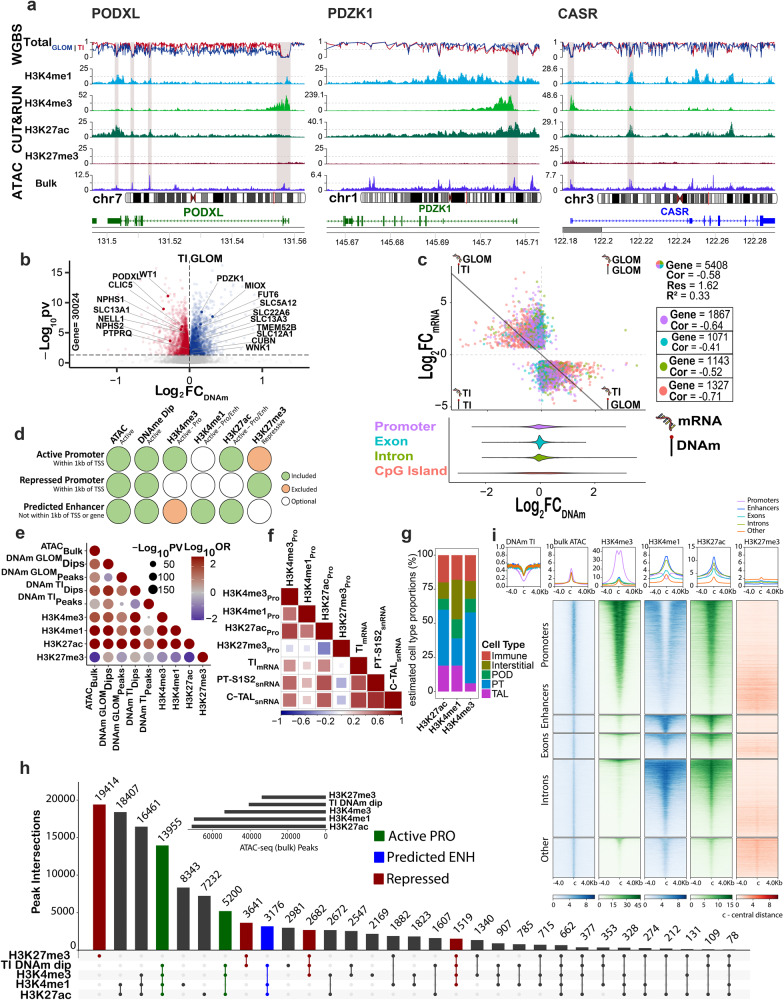
Fig. 2. Alignment of epigenomic features in bulk and regional human kidney samples.
a Epigenomic features of marker genes for glomerulus (PODXL), proximal tubule (PT-S12, PDZK1), and thick ascending loop of Henle (C-TAL, CASR), displaying: (1) DNA methylation (DNAm) in the tubulointerstitium (TI) (N = 15) and glomerulus (GLOM) (N = 15), (2) bulk CUT&RUN for four histone modifications: H3K27ac (N = 6), H3K27me3 (N = 10), H3K4me1 (N = 3), H3K4me3 (N = 3), and (3) assay for transposase-accessible chromatin using sequencing (ATAC-seq) on bulk tissue (Encode ENCSR297VGU) (N = 1). Gray stripes indicate active promoters wherein ATAC-seq peaks at transcriptional start sites coincide with DNAm dips, and H3K4me3 peaks. Variable H3K27ac peaks reflect compartments’ proportion within bulk tissue. b Differential methylation between GLOM and TI kidney compartments for summative methylation of 30,024 gene bodies P value < 0.05 by t test. c Best-fit regression model of methylation and mRNA expression in identical samples (N = 22) for differentially expressed genes (N = 5408) between the GLOM and TI. Each dot represents a gene. Y axis is the Log2 fold change of mRNA between the GLOM and TI. X axis is the Log2 fold change of methylation between the GLOM and TI. The best-fit annotated gene region (summative promoter, exon, intron, of CpG island methylation) with the most negative correlation was identified as the promoter for 1867 genes and CpG island for 1327 genes. The inset represents methylation fold change distribution in annotated gene regions. d Genomic region annotation criteria based on epigenetic landscape. e Landscape correlation agreement between datasets (Fisher’s exact test two sides). f Histone markers and spearman correlation with snRNAseq expression in the PT-S12 and C-TAL and in the regional mRNA expression of the microdissected TI. g Cell type deconvolution of CUT&RUN for H3K27ac, H3K4me1, H3K4me3 active histone modifications at promoters. The RNA signature was taken from the HuBMAP/KPMP atlas snRNAseq (N = 36), using the 10% most DE marker genes. h Upset plot depicting overlap in peaks of H3K27ac, H3K4me1, H3K4me3, and H3K27me3 with DNAm dips across the genome. Active promoters, predicted enhancers, and repressed regions are annotated. i Heatmap of CUT&RUN marks across the genome by annotated region after filtering for open chromatin and DNA methylation dips. The figure uses a licensed stock image adapted from Adobe Illustrator (Eadon et al. - stock.adobe.com).

