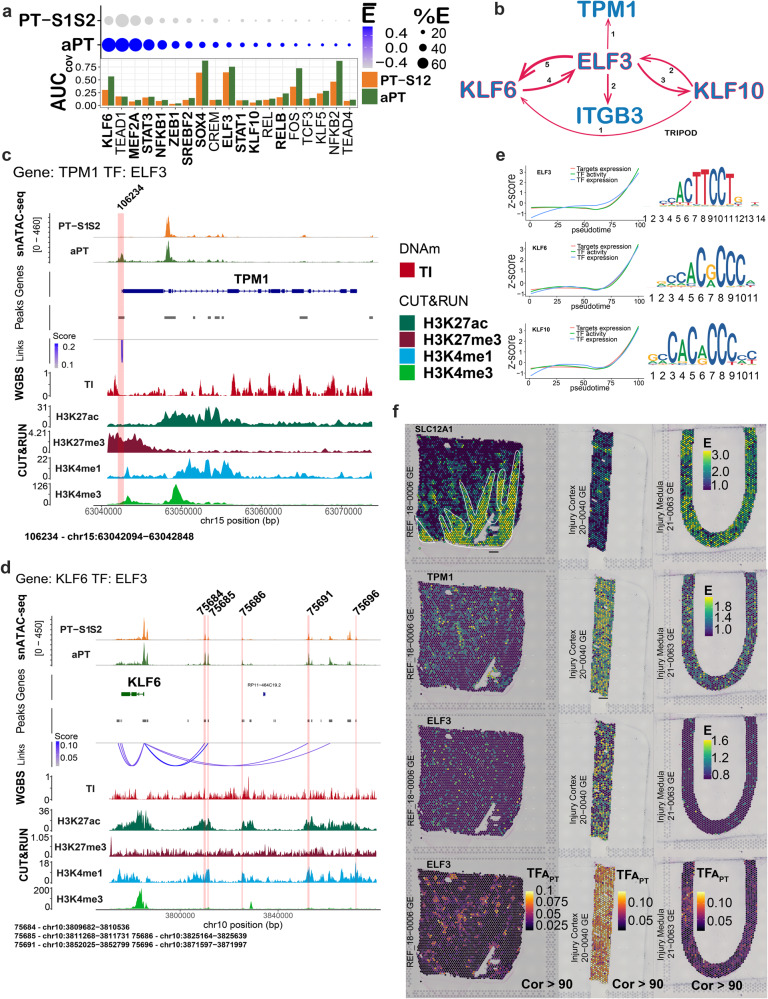
Fig. 6. Regulation of adaptation in the proximal tubule (PT) in the multiome atlas.
a Mean expression and area under the curve (AUC) of summative open chromatin for transcription factors (TF) of the adaptive proximal tubule (aPT) and PT-S1 and S2 (PT-S12) in 12 samples. Bold font indicates expression upregulation in the aPT (negative binomial exact test, p < 0.05 after Bonferroni and average Fold Change >0.25 Supplementary Data 4). b TF network defined by the TRIPOD1 method wherein ELF3, KLF6, and KLF10 cross-regulate each other, and two genes upregulated in the aPT (ITGB3 and TPM1). Edge thickness represents the number of peaks predicted in the interaction. c, d Alignment of epigenomic features in TPM1 and KLF6 for the aPT and PT-S12. Red stripe indicates a peak with predicted TF binding by ELF3. Co-accessibility scores were correlated with gene expression, peak accessibility by Signac, DNAm in the tubulointerstitium (TI), and histone marks. TF Peaks are numbered and correspond to (Supplementary Data 5). e Pseudotime trajectories from PT-S12 to aPT for the expression and activity of TFs ELF3, KLF6, and KLF10 with target gene expression. X axis: pseudotime, Y axis: z score of transformed values based on the standard deviation of the mean. TF motifs are provided to the right. f Representative spatial transcriptomic mapping (N = 3) in a healthy reference, injured cortex, and injured medulla. SLC12A1 defines the corticomedullary distribution (including medullary rays). TPM1 and ELF3 expressions are upregulated in the injured cortex. TF activity of ELF3 is present only in the cortex (in PT dominant spots) and is upregulated in the injured cortex.

