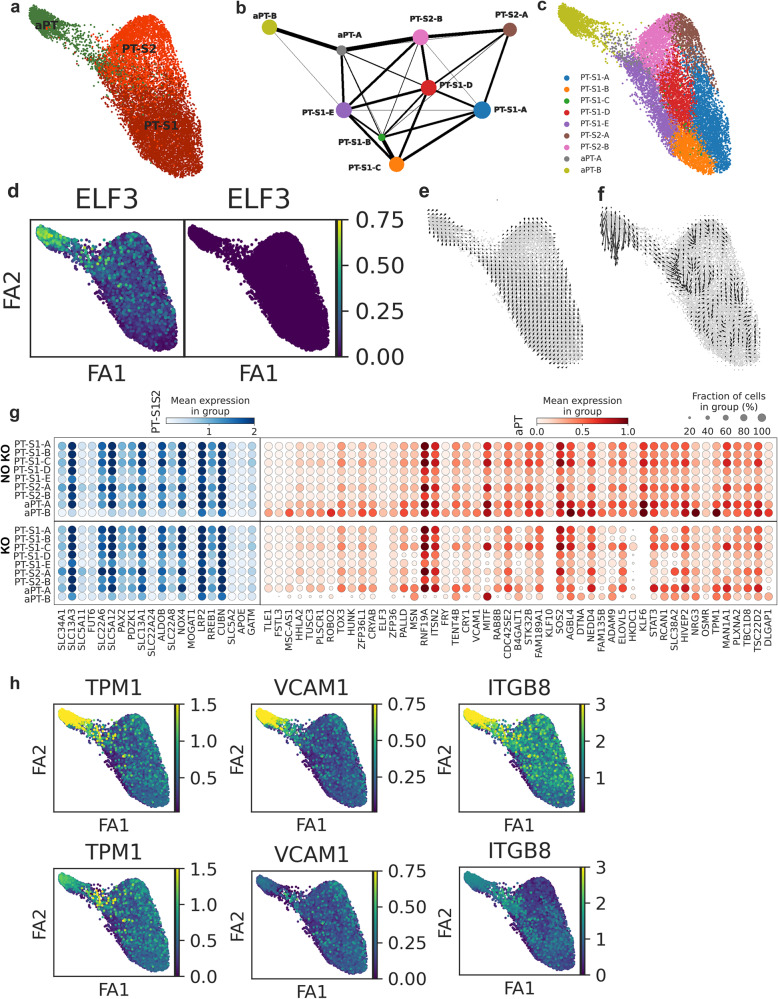
Fig. 7. In silico perturbation knockout in the proximal tubule (PT) (N = 12).
a Cell type distribution of PT-S1, PT-S2, and adaptive PT (aPT). b Partition-based graph abstraction (PAGA) shows the connectivity of 9 subclusters in Louvain annotation. c Cell type annotation distribution across the 9 subclusters. d ELF3, a TF targeting multiple aPT marker genes, is expressed in PT clusters before combined knockout of ELF3, KLF6, and KLF10, but is reduced in expression after knockout. e Cell velocity combined with the pseudotime plot showing the cell flow from PT-S1 and PT-S2 to the aPT cell state. f The cell flow after in silico knockout revealing disruption of the trajectory. g Gene expression in nine subclusters of selected PT-S12 marked genes (blue) and 50 top differential aPT markers before and after combined knockout Benjamini-Hochberg adjusted P value < 0.05 (Wilcox test). h Expression of selected aPT marker genes with predicted TF binding from ELF3, KLF6, or KLF10 before and after combined knockout.

