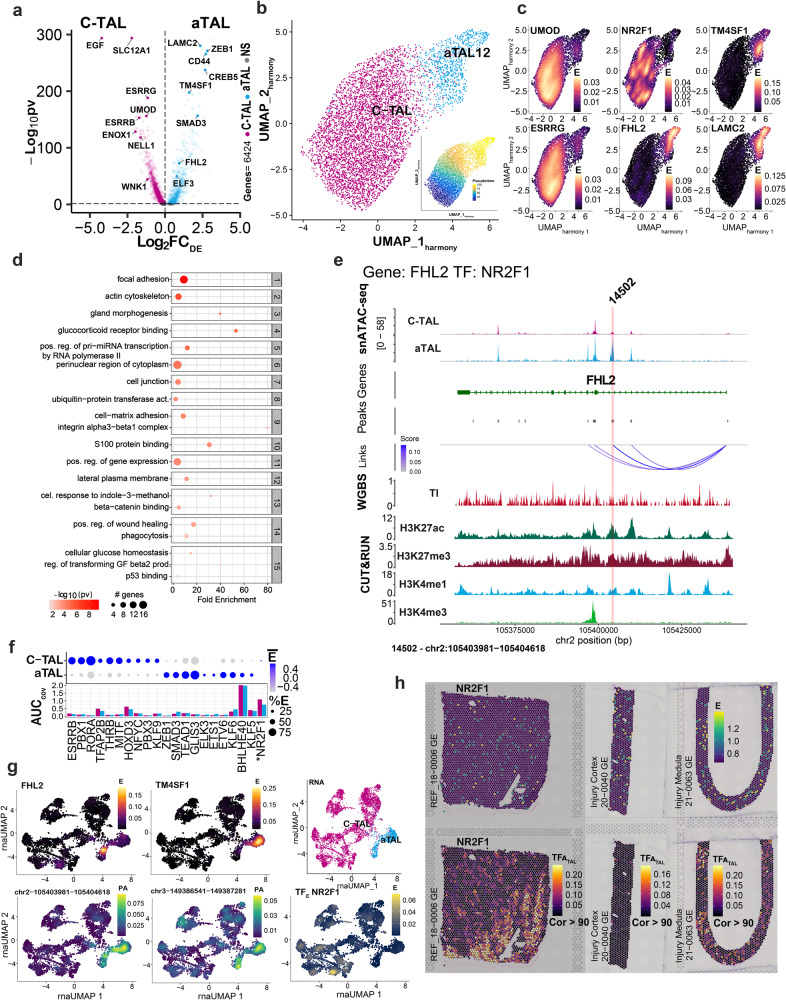
Fig. 8. Adaptation in the cortical thick ascending loop of Henle (C-TAL).
a Differentially expressed genes (DEGs) between the adaptive TAL (aTAL, blue) and C-TAL (magenta), for N = 3152 genes at a Bonferroni adjusted P value < 0.05 (Wilcox test) within the multiome atlas (N = 12). b UMAP harmony of aTAL and C-TAL. Inset shows pseudotime from C-TAL to aTAL. c Gene expression localizes in aTAL cells for aTAL marker genes (LAMC2, FHL2, and TM4SF1). Canonical C-TAL markers (UMOD and ESRRG) are expressed in the TAL. NR2F1 is a TF that is not differentially expressed. d Top 15 clusters from GO-All pathway enrichment analysis at a Bonferroni adjusted P value < 0.05 (enrichment tests). The genes are based on DA regions in the aTAL. Key pathways of the adaptive process overlap with those of the aPT, including mesodermal cell differentiation and adhesion. e Alignment of epigenomic features in TM4SF1 and FHL2 for the aTAL and C-TAL. The red stripe indicates a peak with TF binding by NR2F1. Co-accessibility scores were correlated with gene expression, peak accessibility by Signac, DNAm in the tubulointerstitium (TI), and histone marks. Additional TF peaks and target genes are found in Supplementary Fig. 12. TF Peaks are numbered and correspond to Supplementary Data 13. f Top 10 most differentially expressed TF in the aTAL and C-TAL (by TRIPOD1). The TF NR2F1 is not differentially expressed. The bar plot conveys the AUC of summative gene open chromatin. g The expression of FHL2 and TM4SF1 is highest in the aTAL. The peak activity of the peaks targeted by NR2F1 is also highest in the aTAL region. h Representative spatial transcriptomic mapping (N = 3) in a healthy reference, injured cortex, and injured medulla. NR2F1 expression and activity occur in the medulla, and activity is present in injury.

