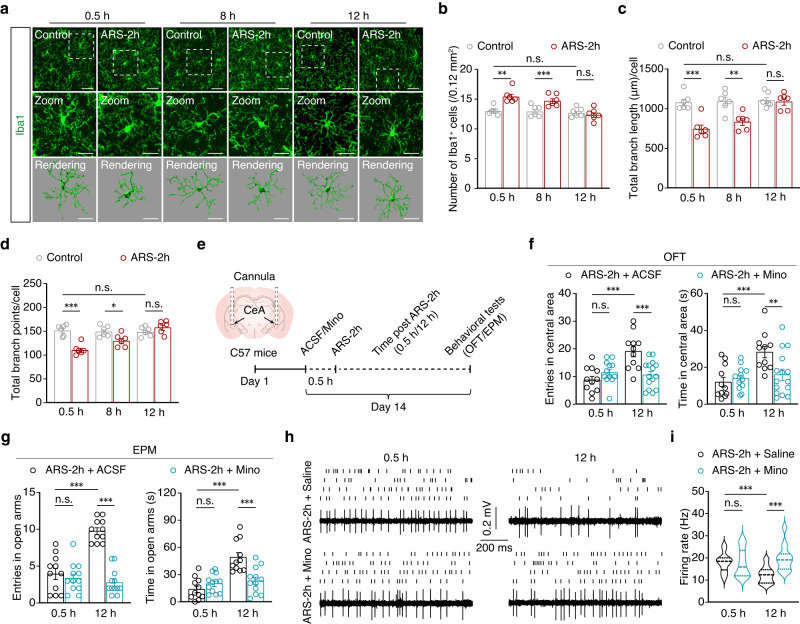
Fig. 2. Extinction of anxiety-like behaviors depends on activated microglia.
a Representative images of Iba1 immunostaining and three-dimensional reconstruction of microglia in the CeA from the indicated groups. Scale bars, 40 μm (overview) and 20 μm (inset and rendering). b Quantification of Iba1+ cell numbers in the CeA from the indicated groups (n = 6 mice per group; F1,30 = 18.79, p = 0.0002). IMARIS-based semi-automatic quantification of cell morphometry, including the total process length (c) and number of branch points (d) of Iba1+ microglia in the CeA from the indicated groups (n = 6 mice per group; c F1,30 = 29.49, p < 0.001; d F1,30 = 18.67, p = 0.0002). e Experimental scheme of ARS-2h mice pre-treated with ACSF or minocycline (Mino). f Summarized data of entries and the time spent in central area of OFT (0.5 h: ARS-2h + ACSF, n = 11 mice, ARS-2h + Mino, n = 12 mice; 12 h: ARS-2h + ACSF, n = 11 mice, ARS-2h + Mino, n = 15 mice; left, F1,45 = 4.068, p = 0.0497; right, F1,45 = 3.477, p = 0.0688). g Summarized data of entries and the time spent in central area of EPM (0.5 h: ARS-2h + ACSF, n = 11 mice, ARS-2h + Mino, n = 12 mice; 12 h: ARS-2h + ACSF, n = 11 mice, ARS-2h + Mino, n = 12 mice; left, F1,42 = 43.09. p < 0.001; right, F1,42 = 6.041, p = 0.0182). Raster plots and typical traces (h) and the quantitative data (i) of the spontaneous firings of GABACeA neurons from the indicated groups (n = 24 cells from six mice per group; i F1,92 = 12.86, p = 0.0005). Significance was assessed by two-way repeated-measures ANOVA with post hoc comparison between groups in (b, c, d, f, g, i). All data are presented as mean ± SEM. *p < 0.05, **p < 0.01, ***p < 0.001; n.s., not significant. See also Supplementary Data 1. Source data are provided as a Source Data file.

