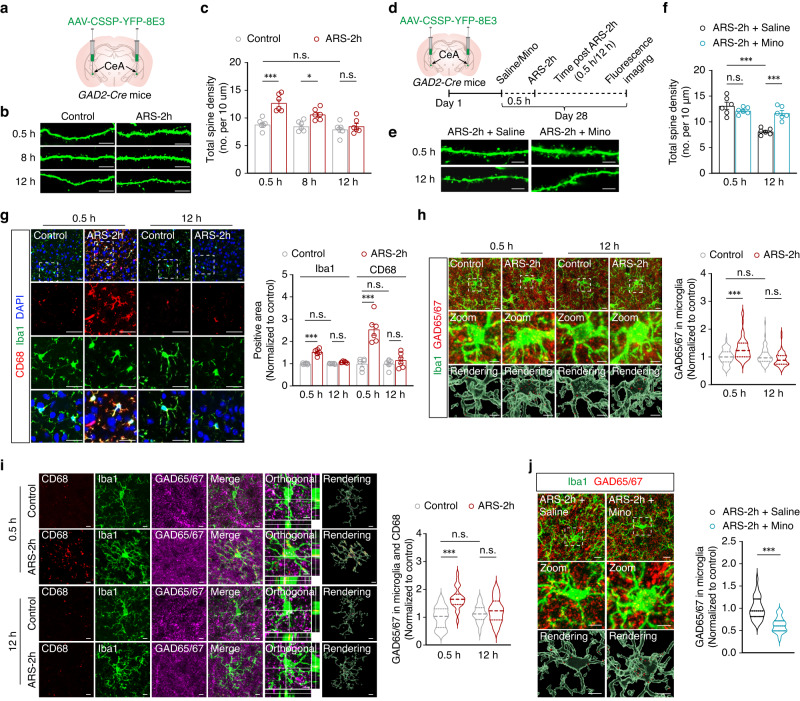
Fig. 3. Extinction of anxiety-like behaviors via microglial engulfment of GABACeA dendritic spines.
a Schematic of bilateral virus infection. Representative images of neuronal dendrites (b) and quantification of spine numbers per 10 μm (c) (n = 6 mice per group; F1,30 = 31.40, p < 0.001). Scale bars, 10 μm. d Experimental scheme for virus injection. Representative images of neuronal dendrites (e) and quantification of spine numbers (f) from the indicated groups (n = 6 mice per group; f F1,20 = 7.743, p = 0.0115). Scale bars, 10 μm. g Representative images (left) and quantitative analyses (right) of immunostaining for CD68 (red), Iba1 (green), and DAPI (blue) in the CeA from the indicated groups (n = 6 mice per group; Iba1, F1,20 = 91.50, p < 0.001; CD68, F1,20 = 30.28, p < 0.001). Scale bars, 20 μm. h Representative images and three-dimensional surface rendering (left) of Iba1+ microglia (green) containing GAD65/67+ puncta (red) and DAPI (blue) in the CeA from the indicated groups. Quantification (right) of GAD65/67+ puncta in microglia in mice (n = 53 cells from six mice per group; F1,208 = 4.789, p = 0.0298). Scale bars, 10 μm (overview) and 5 μm (inset and rendering). i Representative images (left) and quantitative analyses (right) of immunostaining for CD68 (red), Iba1 (green), and GAD65/67+ puncta (purple) in the CeA from the indicated groups (n = 24 cells from six mice per group; F1,92 = 26.55, p < 0.001). Scale bars, 5 μm. j Representative images (left) and quantification (right) of Iba1+ microglia (green) containing GAD65/67+ puncta (red) in the CeA from the indicated groups (n = 30 cells from six mice per group; t58 = 6.739, p < 0.001). Scale bars, 10 μm (overview) and 5 μm (inset and rendering). Significance was assessed by two-way repeated-measures ANOVA with post hoc comparison between groups in (c, f, g, h, i), two-tailed unpaired Student’s t-test in (j). All data are presented as mean ± SEM. *p < 0.05, ***p < 0.001; n.s., not significant. See also Supplementary Data 1. Source data are provided as a Source Data file.

