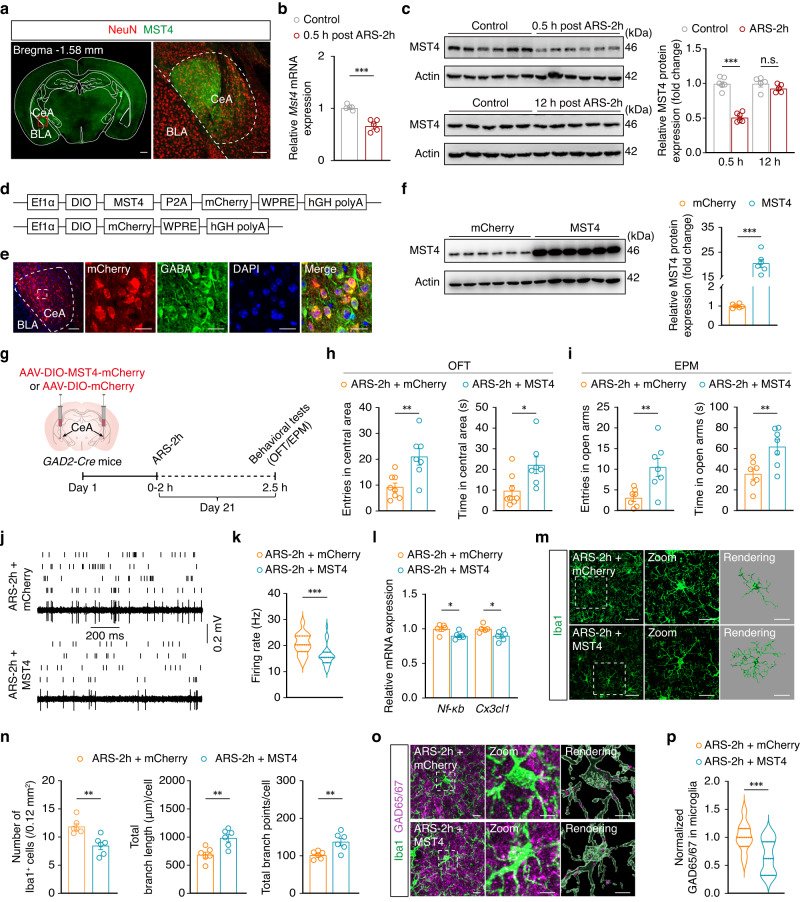
Fig. 5. Overexpression of MST4 in GABACeA neurons alleviates anxiety-like behaviors induced by acute stress.
a Immunofluorescence staining of MST4 (green) and NeuN (red) in the CeA. Scale bars, 500 μm (left) and 100 μm (right). b qPCR of Mst4 in the CeA (n = 5 mice per group). c Western blot analysis of MST4 in the CeA (0.5 h, n = 6 mice per group; 12 h, n = 5 mice per group; F1,18 = 69.87, p < 0.001). d Schematic illustration of the MST4 overexpression construction strategy. e Representative images showing mCherry with co-labeling of GABA-specific antibody. The experiment was repeated three times. Scale bars, 100 μm (left) and 20 μm (right). f Western blot analysis of MST4 in the CeA (n = 6 mice per group; t10 = 12.34, p < 0.001). g Schematic of the experimental procedure. Summarized data of entries and the time spent in the central area and open arms of OFT (h) and EPM (i). Raster plots and typical traces (j) and the quantitative data (k) of the spontaneous firings of CeAGABA neurons (n = 30 cells from six mice per group; k t58 = 4.203, p < 0.001). l qPCR of Nf-κb and Cx3cl1 in the CeA from the indicated groups (n = 6 mice per group). m Representative images of Iba1 immunostaining and three-dimensional reconstruction of microglia in the CeA. Scale bars, 40 μm (overview) and 20 μm (inset and rendering). n The ARS-treated mice showed inhibited activation of microglia after overexpression of MST4 in the CeA (n = 6 mice per group). Representative images (o) and quantification (p) of Iba1+ microglia (green) containing GAD65/67+ puncta (purple) in the CeA (n = 18 cells from six mice per group). Scale bars, 10 μm (overview) and 5 μm (inset and rendering). Significance was assessed by two-way repeated-measures ANOVA with post hoc comparison between groups in (c), two-tailed unpaired Student’s t-test in (b, f, h, i, k, l, n, p). All data are presented as mean ± SEM. *p < 0.05, **p < 0.01, ***p < 0.001. See also Supplementary Data 1. Source data are provided as a Source Data file.

