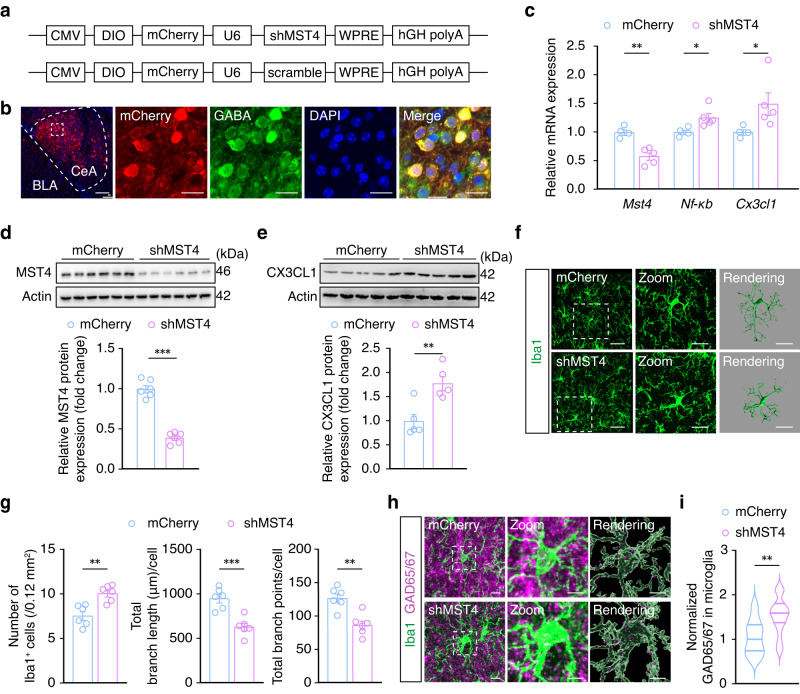
Fig. 6. MST4 knockdown in GABACeA neurons activates microglia and increases the engulfment of GABACeA neuronal spines.
a Schematic illustration of the construction strategy used for MST4 knockdown. b Representative images showing mCherry expression in neurons with co-labeling of GABA-specific antibody. These experiments have been repeated three times. Scale bars, 100 μm (left) and 20 μm (right). c qPCR of Mst4, Nf-κb, and Cx3cl1 mRNA expression in the CeA of naïve mice infected with AAV-mCherry and AAV-shMST4 (mCherry, n = 4 mice per group, shMST4, n = 5 mice per group). d Western blot analysis of MST4 protein in the CeA of naïve mice infected with AAV-mCherry and AAV-shMST4 (n = 6 mice per group; t10 = 11.73, p < 0.001). e Western blot analysis of CX3CL1 protein in the CeA of naïve mice infected with AAV-mCherry and AAV-shMST4 (n = 5 mice per group). f Representative images of Iba1 immunostaining and three-dimensional reconstruction of microglia in the CeA of naïve mice infected with AAV-mCherry and AAV-shMST4. Scale bars, 40 μm (overview) and 20 μm (inset and rendering). g Quantification of Iba1+ cell numbers, total process length and number of branch points of microglia in the CeA from naïve mice infected with AAV-mCherry and AAV-shMST4 (n = 6 mice per group). Representative images (h) and quantification (i) of Iba1+ microglia (green) containing GAD65/67+ puncta (purple) in the CeA from naïve mice infected with AAV-mCherry and AAV-shMST4 (n = 18 cells from six mice per group). Scale bars, 10 μm (overview) and 5 μm (inset and rendering). Significance was assessed by two-tailed unpaired Student’s t-test in (c, d, e, g, i). All data are presented as mean ± SEM. *p < 0.05, **p < 0.01, ***p < 0.001. See also Supplementary Data 1. Source data are provided as a Source Data file.

