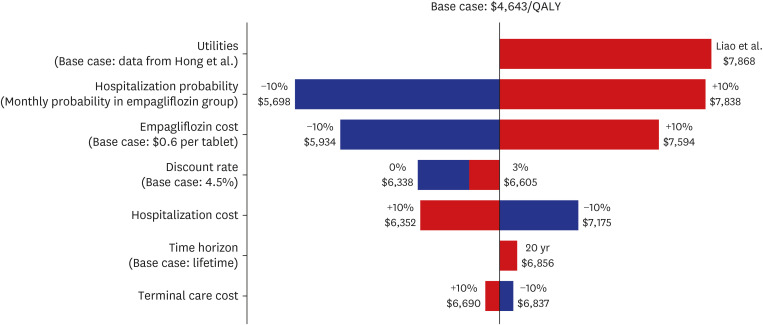
Fig. 3. Tornado diagram for one-way sensitivity analysis. The variables are listed in order of influence on economic evaluation. The value of each variable was changed from the base case and shown as the maximum and minimum incremental cost-effectiveness ratio, which are indicated as bars.
QALY = quality-adjusted life year.

