
Figure 4.
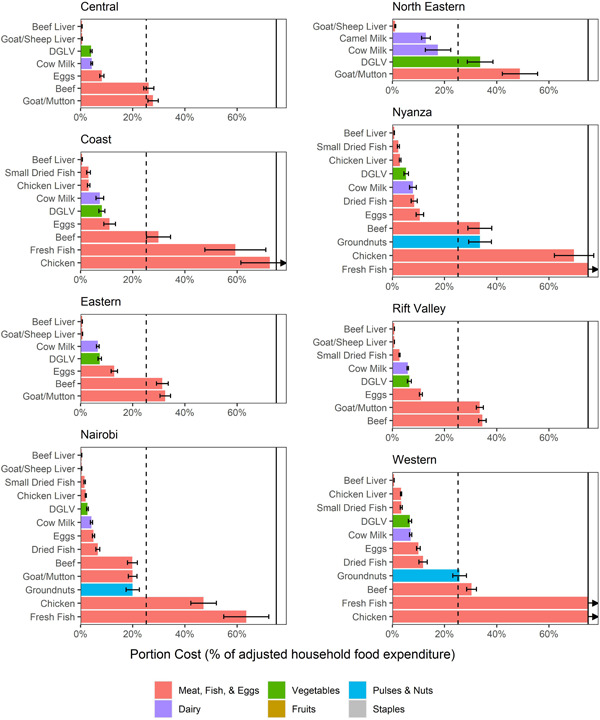
Cost of food portions that could meet one‐third of joint nutrient requirements, as a share of adjusted household food expenditures, by province. Bars were truncated at 75%; arrows indicate that the true values extend beyond 75%. The dashed lines indicate the adjusted joint nutrient affordability threshold of 25.2%; bars below that threshold are considered affordable for the average household. Error bars indicate 95% CIs on the means. The threshold of 25.2% was selected by adjusting the 33.3% threshold used in previous affordability analyses for the lower average food expenditures among households with children aged 6–23 months in Kenya, as observed in the survey data.