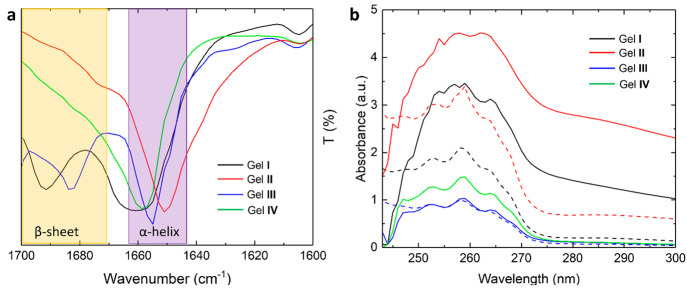
Figure 5.
(a) IR spectra of gels I–IV showing the amide I region (1600–1700 cm–1). (b) UV–vis absorption spectra. Dashed curves correspond to the spectra of precursors 1 (black), 2 (red), and 3 (blue) in solution and solid curves to their corresponding gels I, II, III, and IV (green). All measurements were performed on gels one day after gelation. For all samples, in solution and gel state, the concentration was 50 mM. The optical path length was 1 mm.

