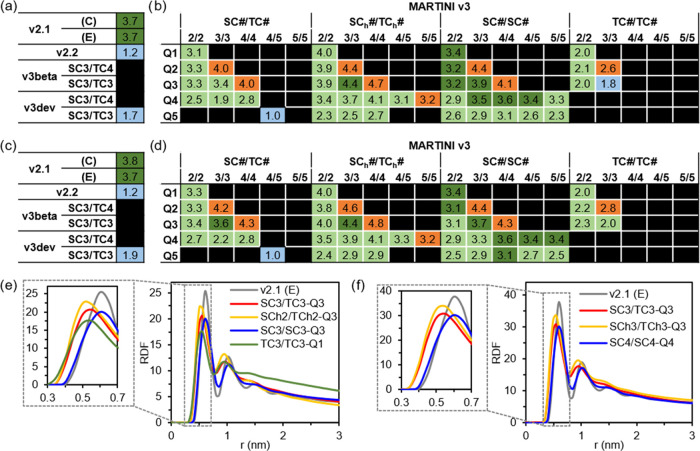
Figure 3.
AP results for the MARTINI 3 Screening Step 2, (a, c) including v2.1, v2.2, and variations of v3beta and v3dev, and (b, d) the screening of bead types for v3, for the (a, b) 1200 and (c, d) 1600 FF molecule simulation systems in a 24.5 nm side box. Results are colored according to the structures formed: solution/nonaggregated (blue), solid (orange), tube-compatible (green), and tubes (darker green). Values discarded in the previous screening are shaded in black. Radial distribution function (RDF) graphs of the aromatic side chains (using the center of mass of the three beads) of examples for the different bead compositions in v3 (e) with a similar AP score from the simulations in Screening Step 1 (Figure 2g,h) and (f) of tube-forming sets from Screening Step 2 (Figure 3c,d). Both include v2.1 (E) as a reference and a zoomed region in the inset on the left (dashed in gray).

