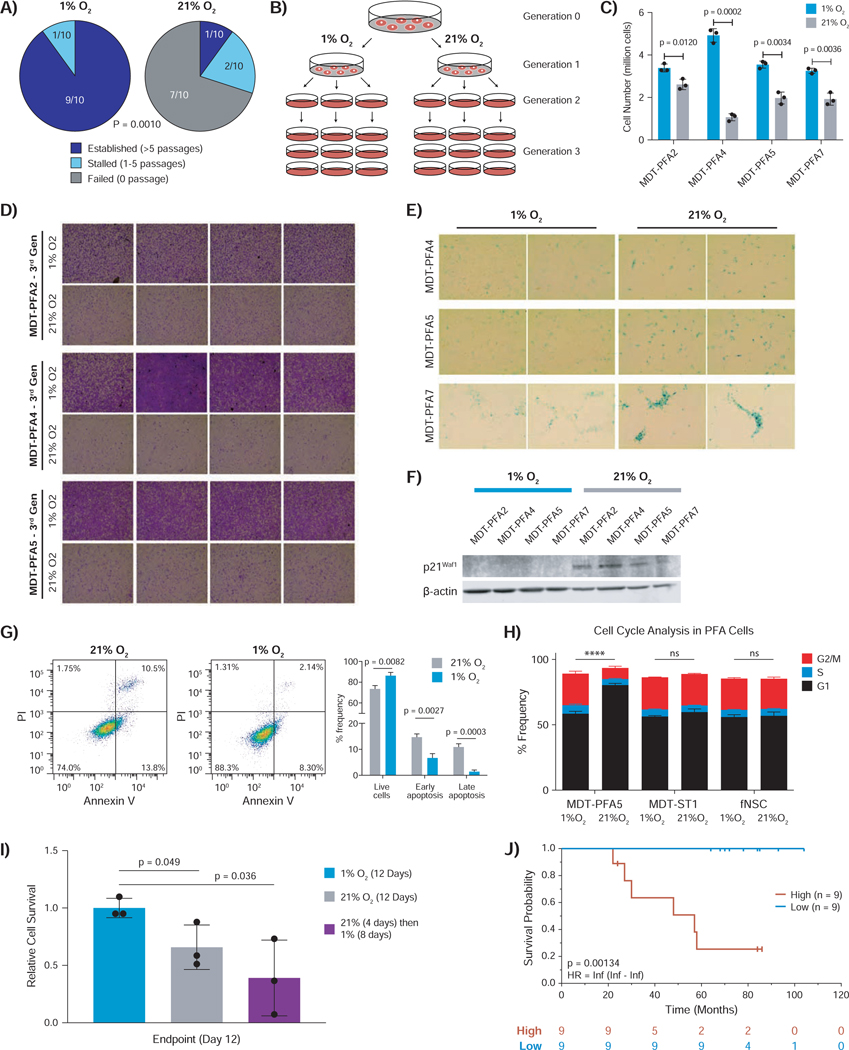
Figure 1 – PFA ependymoma mandates hypoxic conditions.
A) Patient derived PFA ependymoma primary cells undergo sustained growth in 1%, but not 21% oxygen. Cell lines were considered established if they could sustain 5 consecutive passages in culture, stalled if fewer than 5 passages, and failed if they never demonstrated growth in vitro. Two tailed Fisher’s exact test was used for statistical comparison.
B) Schematic representation of continuous culture in 1% versus 21% O2. A “generation” denotes a consecutive passage in each condition.
C) Proliferation of PFA cells cultured continuously in 1% O2 (blue) is significantly sustained and increased compared to 21% O2 (grey). Cell counts represent average viable cells remaining per plate at the end of the 3rd generation. Statistical comparison was performed using two-tailed t-test.
D) Crystal violet staining of 3rd generation PFA cells demonstrates high confluence of cells in 1% O2 compared to 21% O2. Each square is a representative image for the culture condition.
E) Senescence-associated β-Galactosidase staining of 3rd generation PFA cells demonstrates increased senescence in 21% O2, but not 1% O2. Blue colour indicates positive X-gal staining.
F) Immunoblot for p21Waf1 demonstrates increased expression in 21% compared to 1% O2.
G) Flow cytometry-based quantification of apoptosis using Annexin V and propidium iodide in PFA cell lines reveals a significant increase in apoptosis in 21% O2. Statistical comparisons were conducted using Welch’s t-test from technical triplicates for each sample.
H) Cell cycle analysis demonstrates an increase in G1 arrest of PFA cells, but not control STEPN or fetal neural stem cells (fNSCs), in 21% O2 versus 1% O2. Statistical comparison was performed using multiple t-testing for the G1 cell cycle phase between 1% vs. 21% oxygen of each cell type.
I) PFA cells cultured in 21% O2 for 4 days and then returned to 1% O2, display an irreversible decrease in proliferation. Statistical comparison was performed using twotailed t-test.
J) Poor outcome among PFA patients with a hypoxic gene signature (MSigDB). Kaplan-Meier survival curve stratified by hypoxia signature (high = red, low = blue) is correlated with worse overall survival in a cohort of 18 PFA patients. Statistical comparison was performed using the log-rank test after FDR correction.

