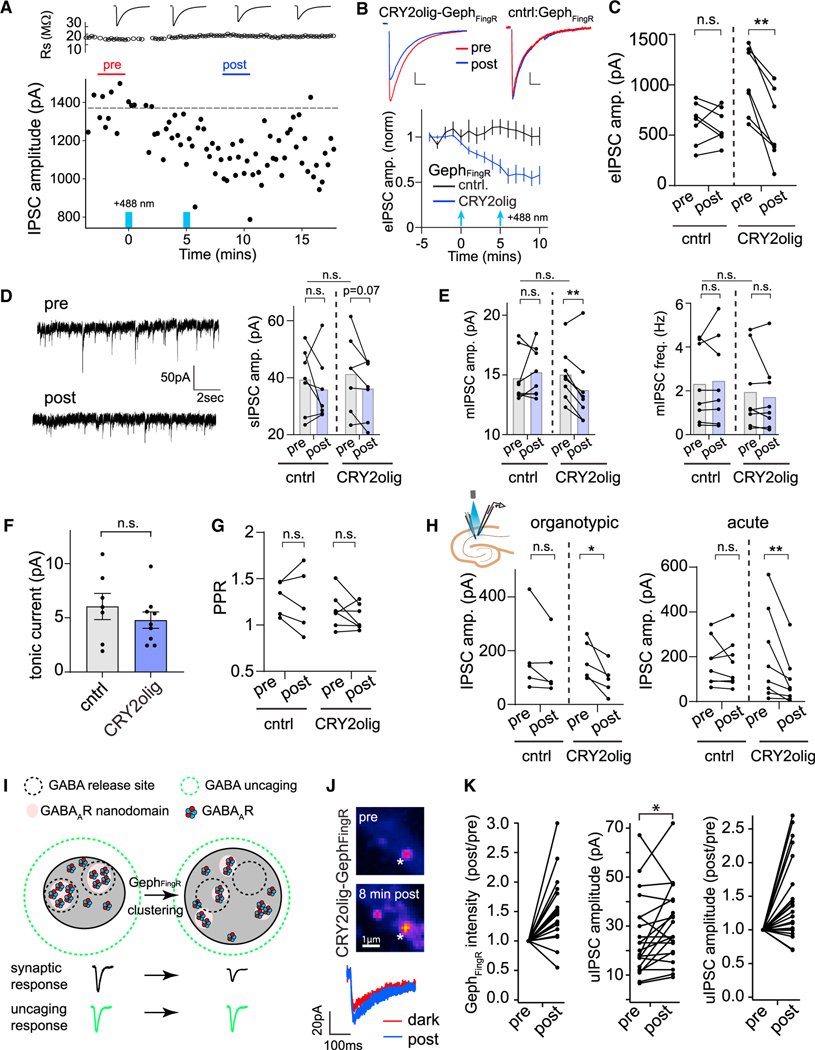
Figure 4. CRY2olig-GephFingR clustering impairs evoked and spontaneous synaptic transmission through GABAAR displacement within the postsynaptic membrane.
(A) Plotted are electrically evoked IPSC amplitudes measured from individual sweeps before and after 2-s light exposures at 0 min and 5 min (denoted by blue bars) recorded from a dissociated hippocampal neuron expressing CRY2olig-GephFingR-GFP. Series resistance measurements are plotted above.
(B) Averaged evoked IPSC amplitudes are plotted as a function of time before and after blue light illumination (2-s pulse, denoted by blue arrows) in dissociated hippocampal neurons expressing GephFingR-GFP (black) or CRY2olig-GephFingR-GFP (blue). Error bars are 95% CI. Example IPSC traces before (red) and 10 min following light exposure (blue) are shown above. Scale bar left, 250 pA, 35 ms. Scale bar right, 150 pA, 45 ms. *p < 0.05; two-way ANOVA. n = 7 cells each condition, from 5 independent cultures.
(C) Paired comparisons of IPSC peak amplitudes before (pre) and 10 min following blue light illumination (post) are shown for hippocampal neurons expressing GephFingR-GFP (cntrl) or CRY2olig-GephFingR-GFP (CRY2olig). **p < 0.01, n.s. non-significant; paired t test, n = 7 cells, from 5 independent cultures.
(D) Left, spontaneous IPSC (sIPSC) example traces within the inter-stimulus intervals from cells in (A)–(C). Right, paired comparison of sIPSC amplitude from the same cells expressing either GephFingR-GFP (cntrl) or CRY2olig-GephFingR-GFP (CRY2olig), before (pre) and 10 min following blue light exposure (post). p = 0.07, n.s. non-significant; paired t test. Comparison of population means for before light (pre) conditions on top. n.s. non-significant; Student’s t test. n = 7 cells, from 5 independent cultures.
(E) mIPSC amplitude (left) and frequency (right) are shown, paired from the same cells expressing either GephFingR-GFP (cntrl) or CRY2olig-GephFingR-GFP (CRY2olig) before (pre) and 10 min following blue light exposure (post). **p < 0.01; paired t test. n.s. non-significant. Comparison of population means for before light (pre) conditions on top. n.s. non-significant; Student’s t test. n = 8 cells.
(F) Tonic GABAAR currents were measured by the change in holding current before and after the addition of picrotoxin in light-treated cells expressing GephFingR-GFP (cntrl) or CRY2olig-GephFingR-GFP (CRY2olig). Error bars represent SEM. n.s. non-significant; Student’s t test, n = 7–9 cells.
(G) Paired-pulse ratios (PPRs) were measured (100-msec interval) from cells expressing GephFingR-GFP (cntrl) or CRY2olig-GephFingR-GFP (CRY2olig) before (pre) and 10 min following blue light exposure (post). n.s. non-significant; paired t test, n = 5–7 cells.
(H) Paired comparisons of IPSC peak amplitudes before (pre) and 10 min after blue light activation (post) are shown for CA1 pyramidal neurons expressing GephFingR-GFP (cntrl) or CRY2olig-GephFingR-GFP (CRY2olig). Data were taken from biolistically transfected organotypic slices (left) or acute slices from AAV-infected mice (right). *p < 0.05; **p < 0.01; paired t test, n = 5 cells organotypic slice, from 5 independent cultures and 8 cells acute slices, from 3 animals.
(I) Model for activation of receptors within subsynaptic domains apposed to GABA release sites (black dashed circles) before and after expansion of the postsynaptic membrane by GephFingR clustering. If electrically evoked IPSCs are reduced due to nanoscale displacement within the postsynapse, uncaging-evoked IPSCs should remain unperturbed as the diffraction-limited uncaging volume releases GABA across the entire postsynaptic membrane (green dashed circle).
(J) Top, images of a hippocampal neuron expressing CRY2olig-GephFingR-Halo (labeled with JF646) before and after light-induced clustering. White asterisk marks location of focal GABA uncaging. Bottom, representative uIPSCs (average of two sweeps) are shown before (red) and 8 min following CRY2olig-GephFingR-Halo clustering (blue).
(K) Paired comparisons of normalized CRY2-GephFingR-Halo intensity (left), raw uIPSC amplitudes (middle), and normalized uIPSC amplitudes (right) before and after CRY2olig-GephFingR-Halo clustering. n = 21 synapses from 7 neurons from 3 independent cultures. Statistical comparisons were only carried out on the raw, non-normalized uIPSC amplitude data. *p < 0.05, paired t test.

