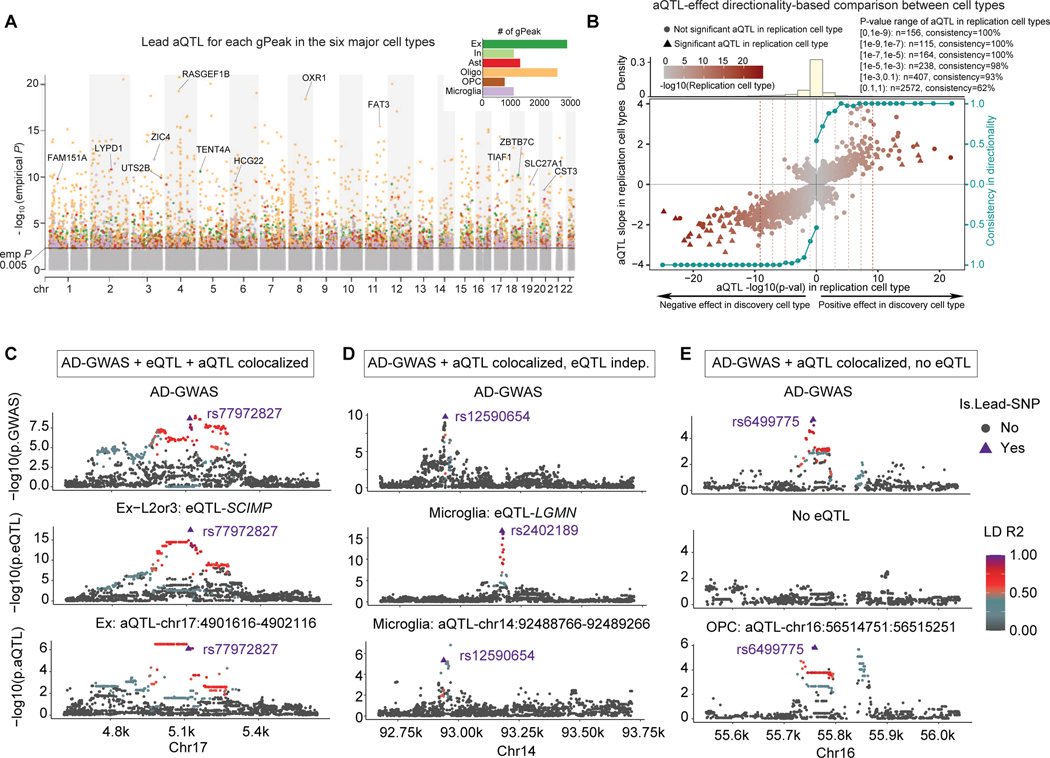
Figure 4. ATAC-QTL analysis and colocalization with AD-GWAS.
A. ATAC-QTL (aQTL) Manhattan plot (lead SNP shown), colored by cell types. Nearest genes of the top aQTL loci from each cell type are indicated. Barplot inset shows the number of genetically-associated peaks (gPeak) discovered in each cell type.
B. Directionality consistency (shown by the right axis) analysis of aQTL effect size (left y-axis) between cell types. For the significant aQTLs in the discovery cell type, the consistency increases as the p-value significance (x-axis) of the replication cell type increases for aQTLs with both positive-effect (right half-plane) and negative-effect (left half-plane). The top panel represents the distribution of aQTL loci within each p-value bin. Separated plots that show the pairwise cell-type comparison are shown in Figure S4C.
C. Example of consistent genetic colocalization across AD-GWAS, cell-type-specific eQTL, and aQTL for the SCIMP locus in excitatory neurons (lead variant shown as triangle).
D. Example of aQTL-AD-GWAS colocalization near the LGMN locus in microglia, with a non-colocalized eQTL in the locus.
E. Example of aQTL-AD-GWAS colocalized locus without any eQTL signal observed in the locus.

