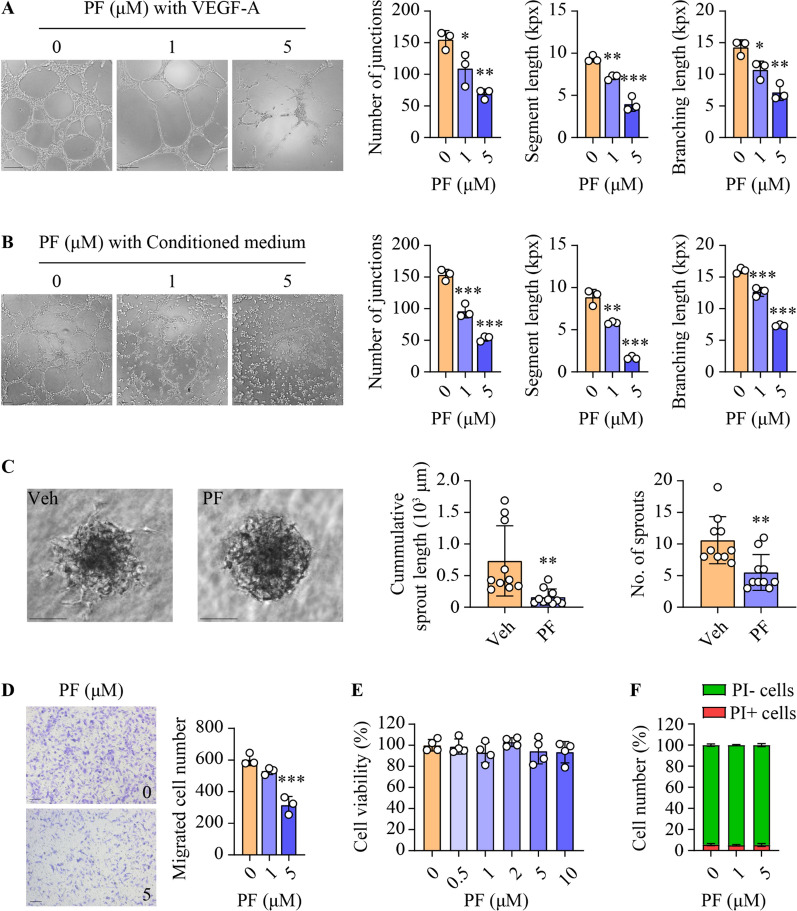
Fig. 4.
Inhibition of SphK1 impairs angiogenesis in HUVECs. Primary HUVECs were treated with PF-543 at the indicated concentrations for 16 h. A and B Tube formation was induced by 50 ng/ml VEGF-A (A) or conditioned medium collected from Huh7 HCC cell culture (B). Quantification of tube formation is presented as the number of junctions, segment length, and total branching length. kpx, 1000 pixels; scale bar = 200 μm (A) or 100 μm (B); n = 3. C Sprouting assays were performed in three-dimensional spheroids. Quantitation of the sprouting is presented as cumulative sprout length and number of sprouts per spheroid; scale bar = 100 μm; n = 10. D Cell migration was determined by transwell assay, and migrated cells were stained with crystal violet; scale bar = 100 μm; n = 3. E Cell viability was determined using MTS assay; n = 4. F Cell death was assessed using flow cytometry with propidium iodide (PI) staining; PI-, living cells (green); PI+, dead cells (red); n = 3. Data are expressed as mean ± SD. *p < 0.05; **p < 0.01; ***p < 0.001

