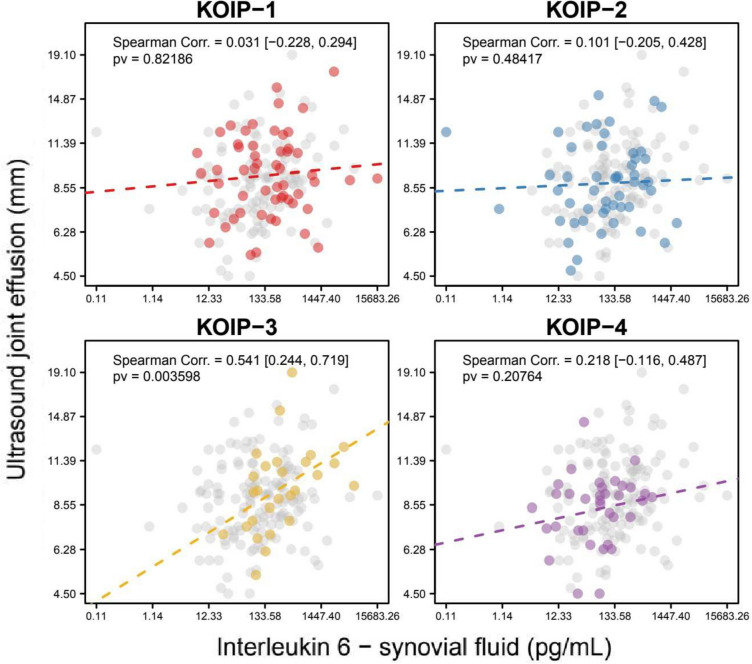
Fig. 4.
Association of synovial interleukin 6 with joint effusion within each knee osteoarthritis inflammatory phenotype (KOIP). The panels show the scatter plots for interleukin 6 protein and joint effusion (mm) measured by ultrasound in each KOIP group separately, the Spearman correlation coefficient, and its corresponding asymptotic 95% confidence interval (between brackets) and p-value. Interleukin 6 protein values are represented in a transformed scale according to Tukey’s ladder of powers, to symmetrize their distribution and make them more suitable for graphical representation (transformation parameter, g = 0.25); x-axis labels are shown in the original scale. Values from patients not belonging to the indicated KOIP group are represented in grey. Corr., correlation; pv, p-value; KOOS, Knee injury and Osteoarthritis Outcome Scores (reversed scores); KOIP, knee osteoarthritis inflammatory phenotype

