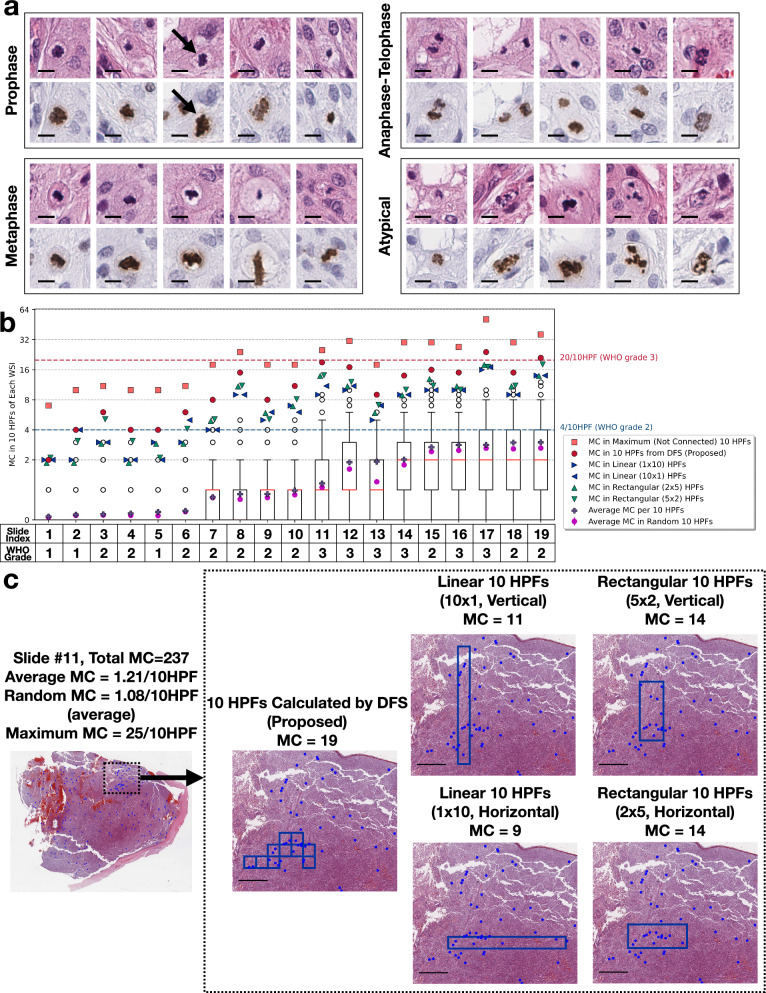
Fig. 4.
a Example of annotated mitoses in the meningioma WSIs at different phases, including prophase, metaphase, anaphase-telophase, and atypical mitoses, bar=10. b Hotspot MC per 10 HPFs in each WSI using five methods of quantification, namely the proposed DFS algorithm, linear 10 HPFs (i.e., and arrangements), rectangular 10 HPFs (i.e., and arrangements), average MC per 10 HPFs, and maximum possible MC in 10 (not connected) HPFs. For the MC distribution in randomly-sampled 10 HPFs: the box-whisker plot shows the percentiles and medians, and the magenta error bars demonstrate the average and 95% confidence intervals. For each WSI, the WHO grade assigned at the consensus conference was included. c Mitosis distribution in slide #11, and the spatial distribution of 10 HPFs with the proposed DFS algorithm (MC=19), linear 10 HPFs (MC=9 or 11), and rectangular 10 HPFs (MC=14), bar=1mm

