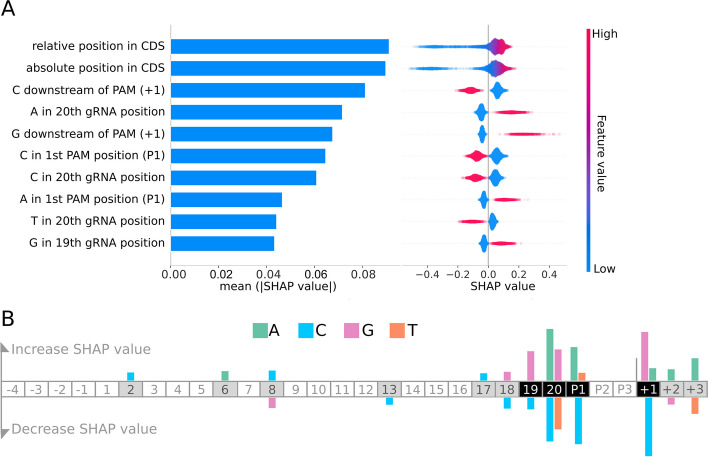
Fig. 3.
Important features for CRISPRi guide efficiency illustrate sequence preferences. A SHAP values for the top 10 features from MERF optimized random forest model. Global feature importance is given by the mean absolute SHAP value (left), while the beeswarm plot (right) illustrates feature importance for each guide prediction. CDS: coding sequence. B A summary of effects of sequence features. Increased SHAP values indicate features that lead to reduced guide efficacy, while decreased SHAP values indicate increased guide efficacy. The guide sequence is numbered G1 to G20 and the three positions of the PAM sequence are labeled P1, P2, and P3. Negative and positive numbers refer to positions preceding the guide sequence and following the PAM, respectively

