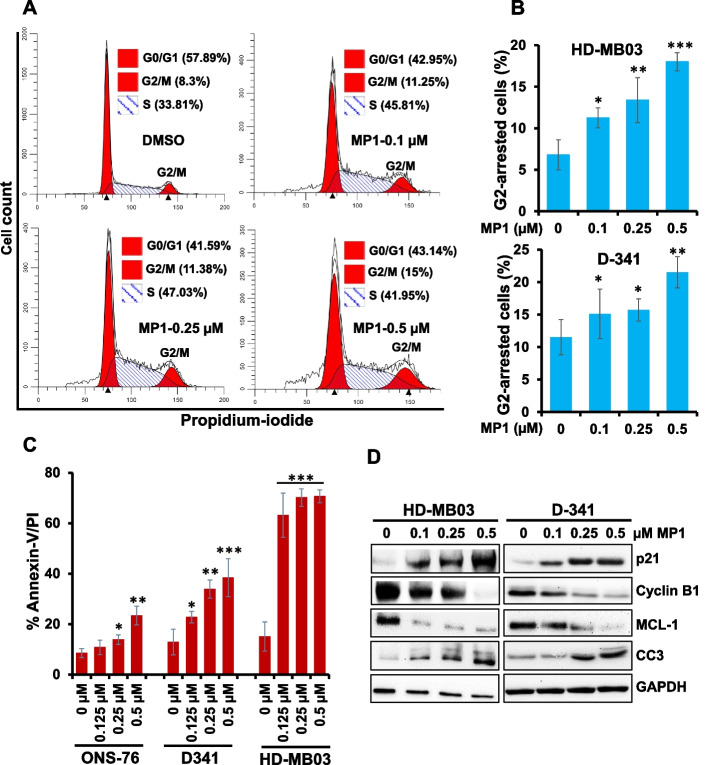
Fig. 2.
MP1 arrests G2-cell cycle and induces apoptosis. A Representative flow diagrams for cell cycle distribution of MYC-amplified MB cell line HD-MB03 following dose-dependent treatment with MP1 for 24 h and then staining with propidium-iodide (PI). B Quantification of the percentage of G2-phase arrested cells following treatment of two MYC-amplified (HD-MB03, D-341) cell lines with MP1 across a dose range for 24 h. The results shown here reflect three replicates. Values, mean ± SEM. *p < 0.05; **p < 0.01; ***p < 0.005 (Student-t-test). This p-value denotes significance between 0 (DMSO solvent) and each MP1 treatment. C Bar graphs show flow cytometry-derived quantification of Annexin-V/PI double positive apoptotic cells in two MYC-amplified (HD-MB03, D-341) and one non-MYC-amplified (ONS-76) MB cell lines treated with MP1 as indicated. Results are representative of three independent experiments. Plotted values and error bars represent mean ± SEM. *p < 0.05; **p < 0.01; ****p < 0.001 (Student-t-test). The p-values denote significance between 0 (DMSO-control) and each MP1 treatment. D Western blotting for the expression of proteins associated with G2 phase of the cell cycle (Cyclin B1, p21) and apoptosis (MCL-1, Cleaved-caspase 3) in MP1 treated HD-MB03 and D-341 cells (as indicated) for 24 h. Vinculin was used as the loading control in this experiment

