Fig. 3.
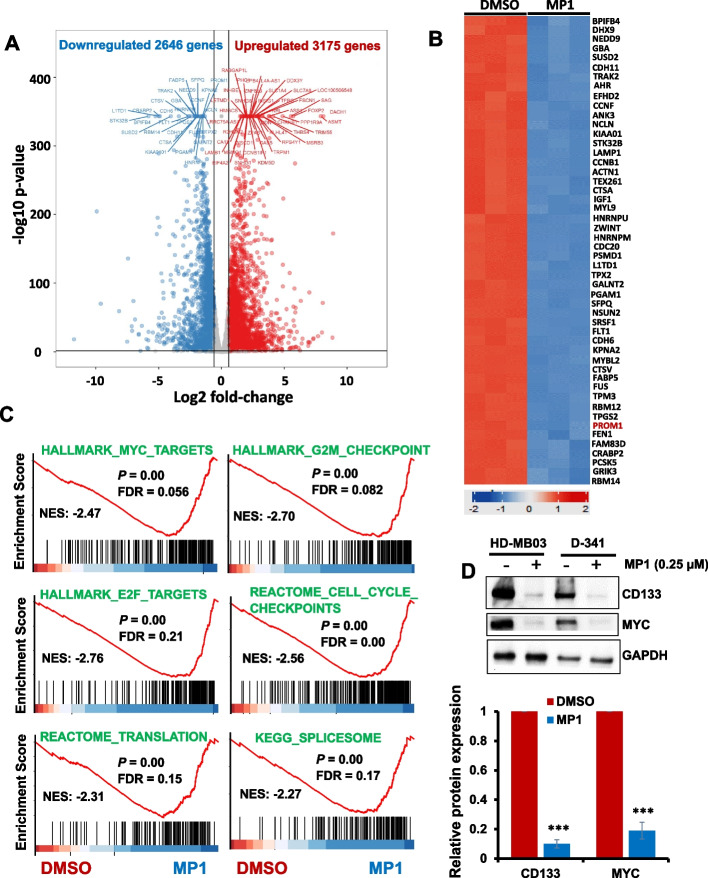
Effects of MP1 on global gene expression. Using RNA-seq, gene expression studies were performed in HD-MB03 cells 24 h after treatment with DMSO (vehicle control) or MP1 (0.25 µM). A Volcano plot showing total number of genes significantly upregulated or downregulated by MP1, compared to DMSO. B Heatmap showing the top 50 genes most significantly downregulated by MP1 treatment. C GSE analysis for the enrichment/modulation of cancer target gene sets (including MYC-associated target gene sets) by MP1, compared to DMSO. FDR, false discovery rate. D Western blotting for the expression of CD133 (one of the top 50 downregulated genes by MP1) along with MYC protein in HD-MB03 and D-341 cell lines treated with 0.25 µM MP1 for 24 h. GAPDH was used as the loading control in this experiment. Bar graphs show the quantification of expression of key target proteins (shown in western blot images) relative to the DMSO control in the combined blots of HD-MB03 and D-341 cells after GAPDH (loading control) normalization using Image-J software. The values represent the mean ± SEM of three blot replicates. ***p < 0.001 (Student t test, DMSO vs. MP1)

