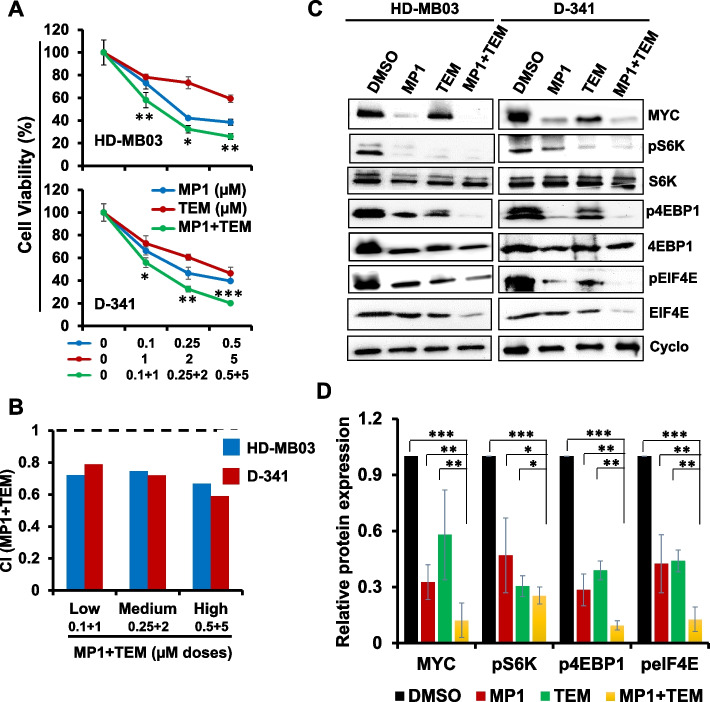
Fig. 6.
Synergistic effects of MP1 and temsirolimus (TEM) on MB cell growth. A Cell viability (MTT) assay showing dose-dependent growth effects of combined MP1-TEM in two MYC-amplified MB cell lines at 48 h. Viable cells (%) is relative to DMSO-treated cells. Values represent mean ± SEM. B Bar graphs show combination index (CI) analyses for the synergism of MP1 and TEM in MB cell lines. C Western blot images for the expression of key components of MYC and translation/mTOR signaling in two MYC-amplified MB cell lines following treatment with MP1 (0.25 µM) and TEM (2 µM) alone or combined for 24 h. Cyclophilin B (Cyclo) was used as the loading control in these analyses. D Bar graphs show the quantification of expression of key target proteins (shown in western blot images) relative to the DMSO control in the combined blots of HD-MB03 and D-341 cells after Cyclophillin B (loading control) normalization using ImageJ software. The values represent the mean ± SEM of three blot replicates. *p < 0.05; **p < 0.01; ***p < 0.001 (Student t test, vehicle/ or single agents vs. combination)

