
Figure 3: Survey-specific results compared with pooled results.
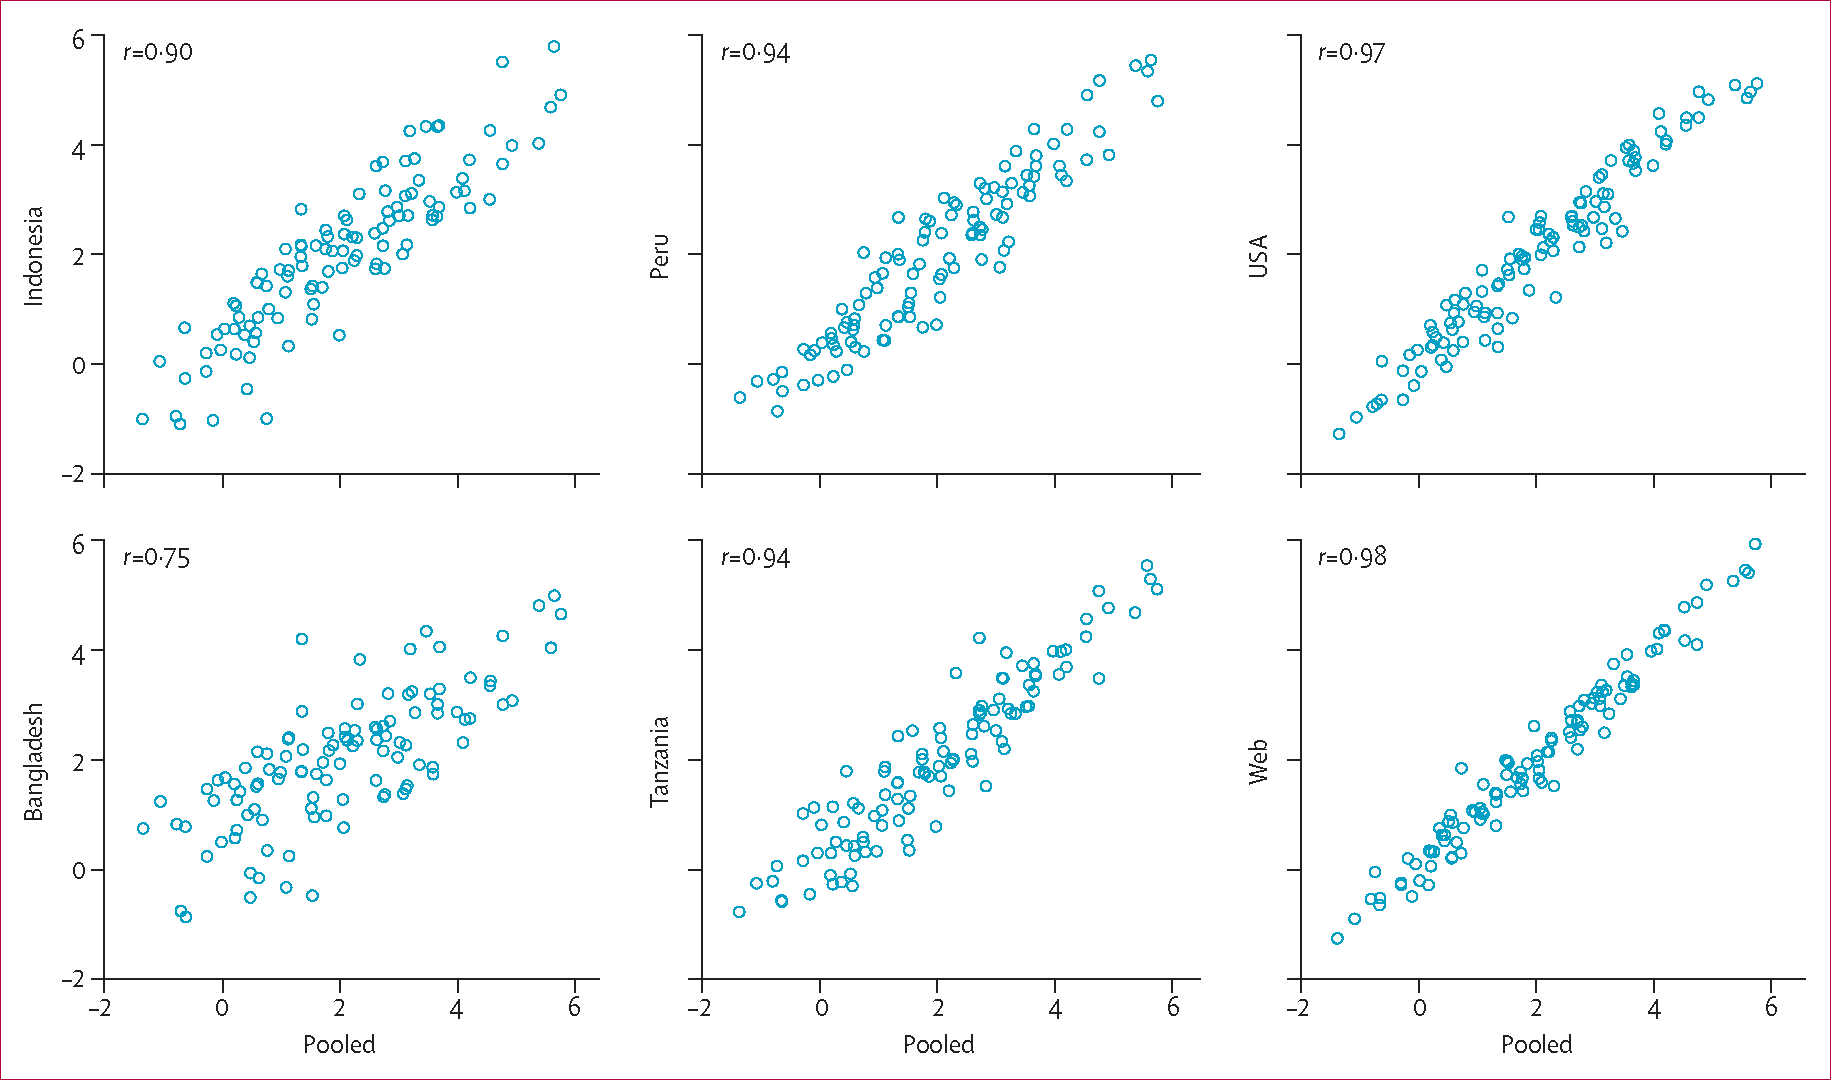
Values on the horizontal and vertical axes in each panel are normalised coefficients from probit regression analyses on paired comparison responses for the 108 health states included in the household surveys (appendix).