Fig. 2.

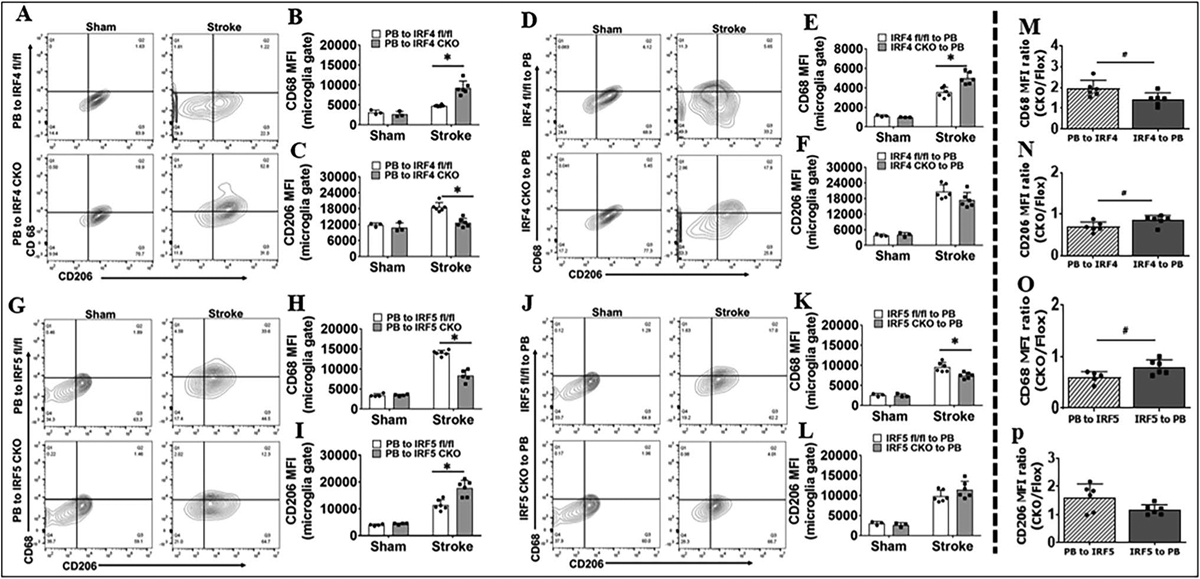
Microglial cell membrane inflammatory markers (CD68 and CD206) in BM chimera analyzed by flow cytometry 3 days after MCAO. Representative flow plots showing CD68+ and CD206.+ cells in A PB-to-IRF4 (CKO and flox), D IRF4 (CKO and flox)-to-PB, G PB-to-IRF5 (CKO and flox), and J IRF5 (CKO and flox)-to-PB chimeras. Quantification of CD68 and CD206 MFI for A in B, C; for D in E, F; for G in H, I; and for J in K, L. The MFI ratios of PB-to-IRF CKO/PB-to-IRF flox (PB to IRF) and IRF CKO-to-PB/IRF flox-to-PB (IRF to PB) in stroke groups are compared in M for B and E, in N for C and F, in O for H and K, and in P for I and L. n = 3–4 per sham and n = 6 per stroke group; *P < 0.05
